


Gravitational lensing can be used as a tool to increase the resolution attainable in studies of distant galaxies. Although morphological information is hard to disentangle because of the geometric distortions and uncertainties in lens modelling, the amplification afforded by strong lensing can allow the stellar populations to be mapped on the sub-kpc scale, as well as magnifying the total flux.
4.1 Optical/Near-Infrared Imaging of Lensed Arcs at z = 4.04
Combining archival HST/WFPC 2 data with deep near-infrared imaging
taken with Keck/NIRC
(Matthews & Soifer
1994)
in good seeing, we have
measured the spatially-resolved colours in a z = 4.04 galaxy,
gravitationally lensed by the rich cluster Abell 2390 (z
 0.23)
into a pair of highly-magnified near-linear arcs 3-5" in length
(Frye & Broadhurst
1998).
At the redshift of these arcs, the H
(
0.23)
into a pair of highly-magnified near-linear arcs 3-5" in length
(Frye & Broadhurst
1998).
At the redshift of these arcs, the H
( cent
1.65 µm) and
k (cent
2.2 µm)
near-infrared pass-bands straddle the
age-sensitive rest-frame 4000 Å+ Balmer break
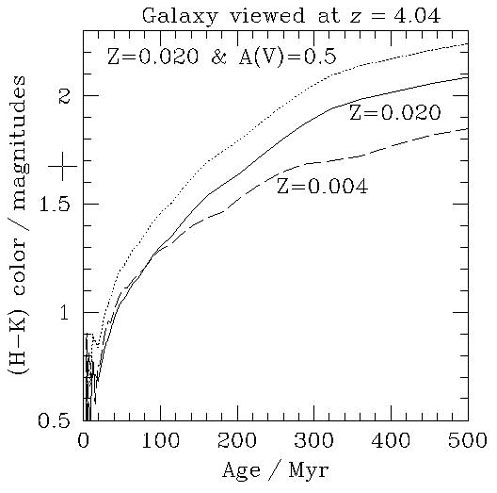
(Fig. 6). Comparison of the optical and
near-infrared photometry with a suite of spectral evolutionary models
(the latest version of
Bruzual & Charlot
1993)
has enabled us to map
the underlying stellar populations and differential dust extinction
(Bunker et
al. 1998a).
The WFPC2 images clearly reveal several knots,
bright in the rest-ultraviolet, which correspond to sites of active star
formation. However, there are considerable portions of the arcs are
significantly redder, consistent with being observed > 100 Myr after
star formation has ceased, with modest dust extinction of E(B -
V)
0.1m. There is degeneracy in the models between dust
reddening and
age for the optical/near-infrared colours, but the most extreme scenario
where the colour gradients are solely due to heavy dust reddening of an
extremely young stellar population are strongly ruled out by upper
limits in the far-infrared/sub-mm from ISO/SCUBA
(Lémonon et
al. 1998;
Blain et al. 1999).
cent
1.65 µm) and
k (cent
2.2 µm)
near-infrared pass-bands straddle the
age-sensitive rest-frame 4000 Å+ Balmer break
(Fig. 6). Comparison of the optical and
near-infrared photometry with a suite of spectral evolutionary models
(the latest version of
Bruzual & Charlot
1993)
has enabled us to map
the underlying stellar populations and differential dust extinction
(Bunker et
al. 1998a).
The WFPC2 images clearly reveal several knots,
bright in the rest-ultraviolet, which correspond to sites of active star
formation. However, there are considerable portions of the arcs are
significantly redder, consistent with being observed > 100 Myr after
star formation has ceased, with modest dust extinction of E(B -
V)
0.1m. There is degeneracy in the models between dust
reddening and
age for the optical/near-infrared colours, but the most extreme scenario
where the colour gradients are solely due to heavy dust reddening of an
extremely young stellar population are strongly ruled out by upper
limits in the far-infrared/sub-mm from ISO/SCUBA
(Lémonon et
al. 1998;
Blain et al. 1999).

|
|
Figure 6. Top: An illustration of the unreddened rest-frame optical spectra of two galaxies, one observed only 3 Myr after the end of an instantaneous burst of star formation (long-dash curve) and the other seen after 400 Myr have elapsed (solid line). We also show the 3 Myr model with dust extinction of AV = 0.5m, typical of high-z star-forming galaxies (e.g., Pettini et al. 1998; Steidel et al. 1999). Note the strong Balmer + 4000 Å break due to the older stars. Also plotted (dotted lines) are the H and k filters in the rest-frame of a z = 4.04 galaxy, straddling the break. The SEDs come from the latest Bruzual & Charlot models. Bottom: The evolution of the (H - K) colour of a galaxy at z = 4.04 as a function of the time elapsed since an instantaneous burst of star formation. The solid curve is the Bruzual & Charlot model for Solar metallicity (z = 0.020), with the dashed line showing lower metallicity, 1/5 solar (z = 0.004). For this redshift, the (H - K) colour is an excellent tracer of the time elapsed since the end of star formation. The dotted curve is the solar-metallicity model with dust reddening of AV = 0.5m. |
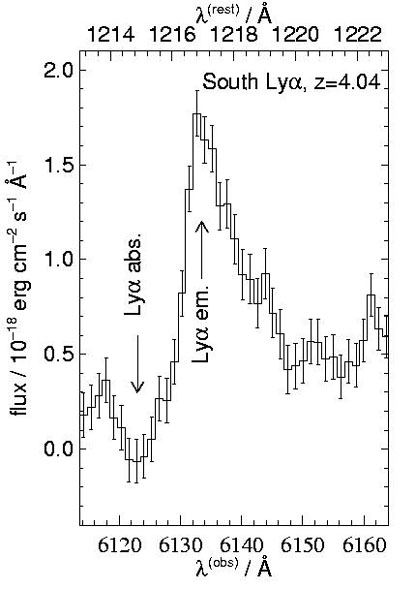
We have obtained optical spectroscopy from Keck/LRIS at moderate
dispersion ( /
 FWHM
1000) with a long
slit aligned along the major axis of the arcs
(Fig. 7). Our 4 ksec spectrum shows regions with
Ly-
FWHM
1000) with a long
slit aligned along the major axis of the arcs
(Fig. 7). Our 4 ksec spectrum shows regions with
Ly- in emission that are
adjacent to some of the bright knots seen in the optical HST images
which sample the rest-frame ultraviolet (Figs. 7
& 9). The non-detections of
N V 1240 Å, C IV 1549 Å &
He II 1640 Å strongly favor the interpretation that
the Ly- arises from the
Lyman continuum flux produced by OB
stars, rather than the harder ultraviolet spectrum of an AGN. We see the
Ly- line morphology
extending
1" beyond the
ultraviolet continuum, which we attribute to resonant scattering from
H I
(Bunker, Moustakas &
Davis 2000).
In the bright knots, the SEDs are
consistent with a very young stellar population (< 10 Myr) or ongoing
star formation.
in emission that are
adjacent to some of the bright knots seen in the optical HST images
which sample the rest-frame ultraviolet (Figs. 7
& 9). The non-detections of
N V 1240 Å, C IV 1549 Å &
He II 1640 Å strongly favor the interpretation that
the Ly- arises from the
Lyman continuum flux produced by OB
stars, rather than the harder ultraviolet spectrum of an AGN. We see the
Ly- line morphology
extending
1" beyond the
ultraviolet continuum, which we attribute to resonant scattering from
H I
(Bunker, Moustakas &
Davis 2000).
In the bright knots, the SEDs are
consistent with a very young stellar population (< 10 Myr) or ongoing
star formation.
|
Figure 7. Left: the F814W image with
elliptical galaxy
model subtracted (note the counter arcs perpendicular to the axis of the
main arcs, predicted by the lens model of
Frye & Broadhurst
1998).
The area covered by the long-slit optical spectroscopy is shown (slit axis
is vertical). The right panel is this elliptical-subtracted
image, smoothed to |
|
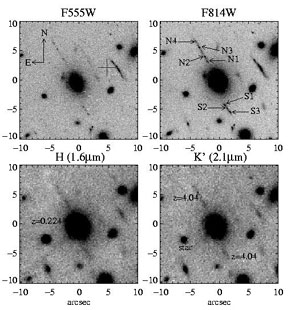
Figure 8. The top panels show archival
HST/WFPC 2 imaging
of the cluster Abell 2390. The z = 4.04 galaxy is the arclet at
PA = +23° that is bisected by the elliptical. Top left is the
HST V-band (F555W, 8400 s) which encompasses
Ly- |
4.3 Evolutionary Status of the z = 4 Galaxy
We have evidence for both ongoing star formation and regions of older
stellar populations in the lensed arcs. It is therefore unlikely that
this z = 4 system in a true 'primæval' galaxy, viewed during its
first major burst of star formation. Rather, our results suggest that
the star formation history of this system has not been coeval, with
current activity concentrated into small pockets within a larger, older
structure. Correcting for the gravitational amplification (estimated to
be 10 from lens models),
the intrinsic properties of the
z = 4.04 galaxy are comparable to the Lyman-break selected
z
3-4 population of Steidel et al.
(1996b,
1999).
The current extinction-corrected star formation rate
(
15 h50-2
M yr-1 for q0 = 0.5) may be
adequate to 'build' an L* galaxy over a Hubble time, but a more
likely scenario may be the creation of a sub-unit which will undergo
subsequent merging with nearby systems (such as the other z = 4.04
galaxy identified in this field by
Pelló et
al. 1999)
to assemble hierarchically the massive galaxies of today.
yr-1 for q0 = 0.5) may be
adequate to 'build' an L* galaxy over a Hubble time, but a more
likely scenario may be the creation of a sub-unit which will undergo
subsequent merging with nearby systems (such as the other z = 4.04
galaxy identified in this field by
Pelló et
al. 1999)
to assemble hierarchically the massive galaxies of today.
| 
|
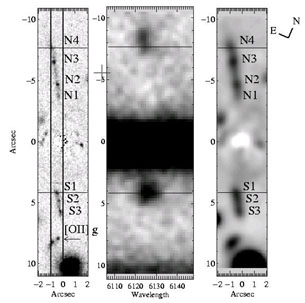
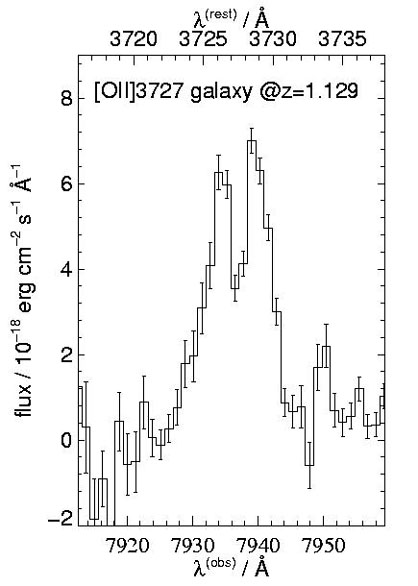
Figure 9. Left:
one-dimensional spectral extraction of the
[O II] | |

|
Figure 10. The broad-band
optical/near-infrared flux from the entire northern arc. Also plotted are
reddened instantaneous-burst stellar population models viewed at various
ages, arbitrarily normalized to the flux measured from the HST/WFPC 2
F814W image. The flux in F555W is severely attenuated by the opacity of
the intervening Ly- |
 = 1 pixel. Note the
spatial range of Ly-
= 1 pixel. Note the
spatial range of Ly-