


The radial peculiar velocity of a galaxy is derived by subtracting the
Hubble velocity H0 d from the total velocity
(redshift) cz
in the desired frame of reference (e.g., CMB or Local Group).
The distance d is inferred from a
distance indicator (DI) whose accuracy dictates the range of applicability
of the technique. The relative distance error of common
DIs ranges from 20% (Tully-Fisher [TF], Fundamental Plane [FP], Brightest
Cluster Galaxy [BCG]) down to 5-8% (Surface Brightness Fluctuations [SBF],
SNIa, Kinetic Sunyaev-Zel'dovich [kSZ]). The bulk velocity
VB of an
ensemble of galaxies within a sphere (or a shell) of radius R is computed
by a least square fit of a bulk velocity model predictions
VB .
 to the observed radial peculiar velocities, where
is a unit vector
in the direction of the object. Current results are summarized in
Table 1
and represented graphically in Figure 1.
to the observed radial peculiar velocities, where
is a unit vector
in the direction of the object. Current results are summarized in
Table 1
and represented graphically in Figure 1.
| Survey | Reff (km s-1) | VB (km s-1) | Dist. Ind. |
| Lauer-Postman (BCG) | 12500 | 700 | BCG |
| Willick (LP10K) | 11000 | 700 | TF |
| Hudson et al. (SMAC) | 8000 | 600 | FP |
| Dekel et al. (POTENT/M3) | 6000 | 350 | TF, Dn - σ |
| Tonry et al. (SBF) | 3000 | 290 | SBF |
| Riess et al. (SNIa) | 6000 | 300 | SN Ia |
| Courteau et al. (SHELLFLOW) | 6000 | 70 | TF |
| Dale & Giovanelli (SFI) | 6500 | 200 | TF |
| Colless et al. (EFAR) | 10000 | 170 | FP |
| Dale & Giovanelli (SCI/SCII) | 14000 | 170 | TF |
| a All references in CFW2000. With the exception of Lauer-Postman (1994), all results are post-1999. | |||
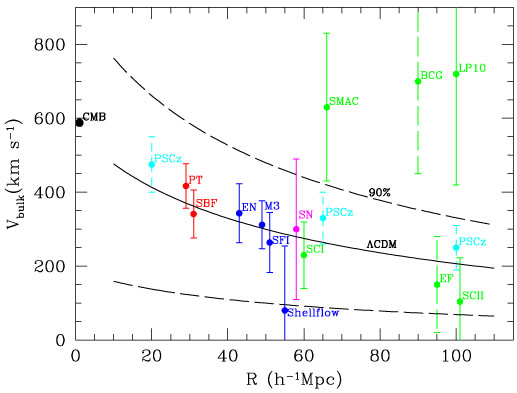
The data sets can de divided into two groups which lie either exactly within or somewhat above the predictions from most (Λ)CDM families. Fig. 1 shows the theoretical prediction of a ΛCDM model for the simplest statistic: the bulk-flow amplitude in a top-hat sphere. The solid line is the rms value, obtained by Eq. 2. The dashed lines represent 90% cosmic scatter in the Maxwellian distribution of V, when only one random sphere is sampled. With the exception of BCG, the directions of the non-zero flow vectors are similar (they all lie within 30° of (l, b) = (280°,0°)) and the velocity amplitudes can be roughly compared even though the survey geometries and inherent sample biases can differ quite appreciably. A rigorous comparison of flow analyses must however account for different window functions (Kaiser 1988, Watkins & Feldman 1995, Hudson et al. 2000). Still, the obvious interpretation of these data is that of a gradual decline of the flow amplitude, or "convergence" of the flow field to the rest-frame of the CMB at ~ 100 h-1 Mpc, consistent with the theoretical assumption of large-scale homogeneity.
|
Figure 1. Amplitude of CMB bulk velocity in top-hat spheres about the LG, in comparison with theory. The curves are the predicted rms and cosmic scatter for a ΛCDM model. The measurements, based on the data listed in Table 1, are crudely translated to a top-hat bulk velocity. The error bars are random only. All the non-zero vectors (except BCG) point to (l, b) = (280°,0°) ± 30°. Shown as well are the LG dipole velocity (labeled "CMB"), and linear estimates from the PSCz redshift survey for β = 0.7. Care must be exercised when interpreting such plots since directions are not plotted and projected amplitudes (VX, VY, VZ) may differ substantially (e.g., Hudson et al. 2000). |
Cosmic variance however prevents any convergence to complete rest. Some of the reported error bars are based on a careful error analysis using mock catalogs, while others are crude estimates. In most cases they represent random errors only and underestimate the systematic biases. Large error bars for surveys such as BCG, LP10, SMAC, SNIa, and Shellflow, with fewer than a thousand "test particles," are largely due to sampling errors which also increase with increasing volumes.
While present bulk flow estimates are in comforting agreement with current cosmologies, important efforts are currently underway to reduce the systematic and random errors inherent in most compilations of galaxy PVs, especially at large distance. The former is addressed by collecting homogeneous data across the entire sky, in the spirit of Lauer-Postman and Shellflow (Courteau et al. 2000). The latter simply requires that large numbers of galaxies and cluster of galaxies be observed to reduce Poisson noise and systematic biases. The nominal sample size to achieve a minimum signal/noise for each spherical volume chosen must be estimated from mock catalogs based on an expected number density profile (as a function of distance or redshift from us) and sky coverage. New surveys including many thousand "test" particles and reaching out to 15,000 km s-1 should quantify the convergence of the peculiar velocity field on very large scales. These surveys include, for example, NFP (2) for the FP measurements of ~ 4000 early-type galaxies in 100 X-ray selected clusters, 6dF (3) for the FP measurements of ~ 15,000 Southern hemisphere early-type galaxies, the SNfactory (4). The detection range should actually extend out to 24,000 km s-1.} for the serendipitous detection and subsequent follow-up of a few hundred SNe per year (Aldering 2001, private communication), and the Warpfire (5) extension of Lauer & Postman (1994)'s BCG analysis. These studies should be completed by 2005, if not sooner.
2.1. The Large-Scale Tidal Field
The cosmological peculiar velocity field at any point can be decomposed into the sum of a "divergent" field due to density fluctuations inside the surveyed volume, and a tidal (shear) field, consisting of a bulk velocity and higher moments, due to the matter distribution outside the surveyed volume. This procedure was carried out by Hoffman et al. (2001), using reconstructions by POTENT (Dekel et al. 1999) or Wiener Filter (Zaroubi, Hoffman & Dekel 1999), with respect to a sphere of radius 60 h-1 Mpc about the Local group. Their results are illustrated in Fig. 2. The divergent component is dominated by the flows into the Great Attractor (left) and Perseus-Pisces (right), and away from the void in between. The tidal field shows, for example, that about 50% of the velocity of the Local Group in the CMB frame is due to external density fluctuations. Their analysis suggests the non-negligible dynamical role of super-structures at distances of 100-200 h-1 Mpc, specifically the Shapley Concentration and two great voids. These should be taken into account when considering the convergence of bulk velocity from different surveys on different scales and of the dipole motion of the Local Group.

|
Figure 2. Wiener filter reconstruction by Hoffman et al. (2001) of the Mark III velocity field in the Supergalactic plane, with respect to the sphere of 60h-1 Mpc about the Local Group (center). The velocities are measured in h-1 Mpc (1 h-1 Mpc = 100km s-1). (a) The full velocity field. (b) The divergent component due to the mass fluctuations within the sphere. (c) The tidal component due to the mass distribution outside the sphere. (d) The residual after subtracting the bulk velocity from the tidal component, including quadrupole and higher moments. The black long arrows in the bottom panels show the projected directions of the bulk velocity and two of the shear eigenvectors respectively. For more information, refer to Hoffman et al. (2001). |
2 astro.uwaterloo.ca/~mjhudson/nfp/ Back.
3 msowww.anu.edu.au/colless/6dF/ Back.
5 www.noao.edu/noao/staff/lauer/warpfire/ Back.