


The peculiar velocities allow direct estimates of Ωm independent of galaxy biasing and Λ. Early analyses have consistently yielded a lower bound of Ωm > 0.3 (e.g., Dekel & Rees 1994), but not a tight upper bound.
Cosmological density estimates from the confrontation of PVs and the distribution of galaxies in redshift surveys have traditionally yielded values in the range 0.3 < Ωm < 1 (95% confidence). This wide span has often been attributed to nontrivial features of the biasing scheme or details of the reconstruction/likelihood method such as the choice of smoothing length. Two common approaches to measuring Ωm are known as the density-density (d-d) and velocity-velocity (v-v) comparisons. Density-density comparisons based on POTENT-like reconstructions (e.g., Sigad et al. 1998) have produced typically large values of Ωm, while v-v comparisons yield smaller estimates (e.g., Willick et al. 1997 [VELMOD], Willick 2000, Branchini et al. 2001). These differences have recently been shown to be insensitive to the complexity of the biasing scheme, whether it be non-linear, stochastic, or even non-local (Berlind et al. 2001; see also Feldman et al. 2001). Thus, one must look for differences inherent to d-d/v-v techniques for an explanation of their apparent disagreement.
Likelihood analyses of the individual PVs (e.g. Zaroubi et al. 1997, Freudling et al. 1999, Zehavi & Dekel 1999) can be used to estimate the power spectrum of density fluctuations under the assumption that these are drawn from a Gaussian random field. In linear theory, the shape of the power spectrum P(k) does not change with time and thus provides a powerful tool to estimate basic cosmological parameters. Moreover, power spectrum analyses of PVs are free of the problems that plague similar determinations from redshift surveys such as redshift distortions, triple-valued zones, and galaxy biasing, and suffer from weaker non-linear clustering effects. Likelihood methods simply require as prior a parametric functional form for P(k).
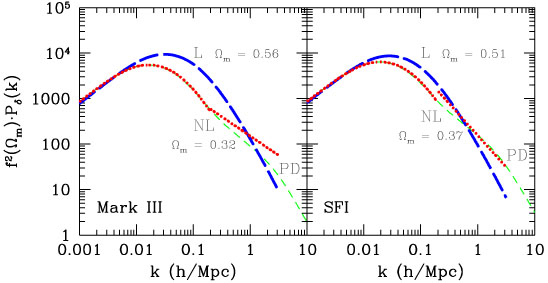
The likelihood analysis of Silberman et al. (2001) incorporates a correction to the power spectrum for non-linear clustering effects, which has been carefully calibrated using new mock catalogs based on high-resolution simulations. The effect of this correction, shown in Fig. 3, is to account for larger power on small scales and suppress the overall amplitude of P(k) on larger scales where clustering is still linear. An unbiased fit of P(k) in the linear regime can thus be achieved, leading to unbiased constraints on the relevant cosmological parameters. The P(k) prior in their analysis assumed a flat ΛCDM cosmological model (h = 0.65, n = 1, COBE normalized), with only Ωm as a free parameter. Fig. 3 gives final fits based on the Mark III (Willick et al. 1997) and SFI (Haynes et al. 1999) catalogs of galaxy PVs. The Mark III catalog is more densely sampled at small distances than SFI and also includes elliptical galaxies which are absent in SFI; the correction for non-linear effects is thus stronger for Mark III. Fitted values for the Mark III data drop from Ωm = 0.56 ± 0.04 in the earlier linear analysis to 0.32 ± 0.06 in the improved analysis, and for SFI from 0.51 ± 0.05 to 0.37 ± 0.09. These revised tight constraints from PVs represent a significant improvement in this analysis.
|
Figure 3. The recovered power spectra by the non-linear likelihood analysis of Silberman et al. (2001) from the data of M3 (left) and SFI (right). The P(k) yielded by the purely linear analysis is marked "L", while the nonlinear analysis, with a break at k = 0.2 h-1 Mpc, is marked "NL". The corresponding values of Ωm are marked. Also shown for comparison is an extrapolation of the linear part of the recovered P(k) into the nonlinear regime by the Peacock-Dodds (1996) approximation. The P(k) is in units of (h-1 Mpc)3. |
These results are in broad agreement with a recent v-v likelihood analysis of SFI PVs against the PSCz IRAS redshift survey by Branchini et al. (2001).
Their procedure entails some
assumptions about the biasing of IRAS galaxies for which PSC redshifts
are measured. If linear biasing were invoked with a biasing parameter
near unity, Branchini et al. would find even smaller values of the density
parameter with 0.15  Ωm
0.30. This exercise and a direct
comparison with the PV-only likelihood analysis of, say, Silberman et al.
is however futile without a proper prescription of galaxy biasing.
The direct analysis of PVs by themselves has the advantage of being free
of the complications introduced by galaxy biasing.
Ωm
0.30. This exercise and a direct
comparison with the PV-only likelihood analysis of, say, Silberman et al.
is however futile without a proper prescription of galaxy biasing.
The direct analysis of PVs by themselves has the advantage of being free
of the complications introduced by galaxy biasing.
A χ2 test applied by Silberman et al. to modes of a Principal Component Analysis (PCA) shows that the nonlinear procedure improves the goodness of fit and reduces a spatial gradient that was of concern in the purely linear analysis. The PCA allows to address spatial features of the data and to evaluate and fine-tune the theoretical and error models. It demonstrates in particular that the ΛCDM models used are appropriate for the cosmological parameter estimation performed. They also addressed the potential for optimal data compression using PCA, which is becoming important as the data sets are growing big.
Intriguingly, when Silberman et al. allow deviations from ΛCDM, they find an indication for a wiggle in the power spectrum: an excess near k ~ 0.05 h-1 Mpc and a deficiency at k ~ 0.1 h-1 Mpc - a "cold flow". This may be related to a similar wiggle seen in the power spectrum from redshift surveys (Percival et al. 2001 [2dF]) and the second peak in the CMB anisotropy (e.g. Halverson et al 2001 [DASI]).