


It was long ago noticed that certain H II region emission-line ratios,
such as [O III] / H ,
vary across the disks of nearby spiral galaxies
(Aller 1942).
The interpretation of this
variation in terms of a metallicity trend was introduced by
Searle (1971),
in a paper that laid
the groundwork for the entire field of abundance gradients. It was soon
followed up by further observational studies
(Smith 1975;
Jensen, Strom, and
Strom 1976)
and a more
rigorous analysis involving the construction of realistic nebular models
(Shields 1974;
Shields and Searle
1978).
From the start it was recognized that there was a need for a
"second parameter" in addition to the O/H ratio, to explain an observed
systematic increase
in O++ / O+ with decreasing O/H.
Shields and Tinsley
(1976)
suggested that this secondary
effect results from a tendency for the effective temperatures of the
ionizing stars to be hotter
for lower O/H, and interpreted it as a metallicity-dependent truncation
of the top end of the
initial mass function (i.e. that the formation of very massive stars is
inhibited by higher
metallicity). Some form of the idea of a Z-dependent IMF is still the
most popular interpretation of the "excitation" trend (e.g.
Vilchez and Pagel
1988;
Campbell 1988),
but it
is also the case that a similar effect can arise from systematic
variations in the nebular geometry and/or filling factor
(Mathis 1985;
Dopita and Evans
1986).
,
vary across the disks of nearby spiral galaxies
(Aller 1942).
The interpretation of this
variation in terms of a metallicity trend was introduced by
Searle (1971),
in a paper that laid
the groundwork for the entire field of abundance gradients. It was soon
followed up by further observational studies
(Smith 1975;
Jensen, Strom, and
Strom 1976)
and a more
rigorous analysis involving the construction of realistic nebular models
(Shields 1974;
Shields and Searle
1978).
From the start it was recognized that there was a need for a
"second parameter" in addition to the O/H ratio, to explain an observed
systematic increase
in O++ / O+ with decreasing O/H.
Shields and Tinsley
(1976)
suggested that this secondary
effect results from a tendency for the effective temperatures of the
ionizing stars to be hotter
for lower O/H, and interpreted it as a metallicity-dependent truncation
of the top end of the
initial mass function (i.e. that the formation of very massive stars is
inhibited by higher
metallicity). Some form of the idea of a Z-dependent IMF is still the
most popular interpretation of the "excitation" trend (e.g.
Vilchez and Pagel
1988;
Campbell 1988),
but it
is also the case that a similar effect can arise from systematic
variations in the nebular geometry and/or filling factor
(Mathis 1985;
Dopita and Evans
1986).
An extensive body of literature has been amassed on the subject of
abundance gradients in
galaxies over the past two decades. Results prior to 1981 were reviewed
by Pagel and Edmunds
(1981;
also see the review by
Shields 1990).
More recent major studies
involving large numbers of galaxies include those of
Webster and Smith
(1983) and
McCall, Rybski, and
Shields (1985).
Not surprisingly, many workers have focused on
large, nearby galaxies with many observable H II regions, such as M 33
(Kwitter and Aller
1981;
Vilchez et al. 1988)
and M 101
(Evans 1986;
Torres-Peimbert,
Peimbert, and Fierro 1989).
The gradients are usually expressed as a logarithmic fit to some 5-10
regions per galaxy, and have a magnitude of about
 log(O/H) /
R = -.08 (±.03)
dex/kpc. This is
similar to the values derived for the solar-neighborhood metallicity
gradient in the Milky
Way galaxy (see Section 3.4. below). It is possible
that the gradients may steepen in the
inner parts of galactic disks. However, this is difficult to prove, both
because the H II
region samples are often small, and more fundamentally because these are
generally the
most metal-rich regions, for which [O III] 4363Å is unobservable
and therefore the derived abundances are heavily model-dependent.
log(O/H) /
R = -.08 (±.03)
dex/kpc. This is
similar to the values derived for the solar-neighborhood metallicity
gradient in the Milky
Way galaxy (see Section 3.4. below). It is possible
that the gradients may steepen in the
inner parts of galactic disks. However, this is difficult to prove, both
because the H II
region samples are often small, and more fundamentally because these are
generally the
most metal-rich regions, for which [O III] 4363Å is unobservable
and therefore the derived abundances are heavily model-dependent.
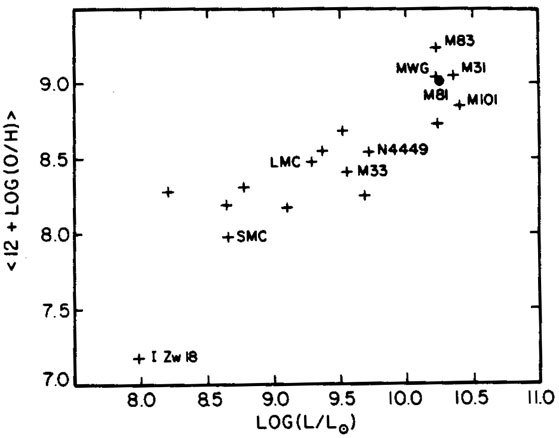
The steepest abundance gradients were initially seen in late-type spiral galaxies (types Sb-Scd). Irregulars and barred spirals tend to have weak or zero radial gradients (Webster and Smith 1983). Early type spirals are harder to study because their H II regions are intrinsically fainter (see Section 1.2 above), but recent studies of M 81 (Sab) show it to have an O/H gradient similar to those of M 33 and M 101 (Stauffer and Bothun 1984; Garnett and Shields 1987). There is at present no convincing evidence that the O/H gradient depends on morphological type among spiral galaxies. However, there is evidence for a good correlation between mean O/H abundance and the overall galaxy mass or luminosity. This can be seen, for example, in Figure 2 (from Garnett and Shields 1987). This trend resembles the correlation of stellar metallicity with galaxy mass, and probably has its roots in the fundamental processes of galaxy formation and evolution (Larson 1976). The extension of this correlation to low-mass galaxies is discussed below.
|
Figure 2. The relationship of mean oxygen abundance to total galaxy luminosity. Reprinted from Garnett and Shields (1987). |
3.3. Elements other than Oxygen
3.3.1. Nitrogen. Along with the trend in [O III] /
H, a similar radial trend was
noted for the ratio [N II] /
H , which decreases with
increasing distance from the centers of spiral
galaxies. Although part of this trend is due to the generally lower
degree of ionization in
the outer H II regions, there also must be a real variation in abundance
(e.g.
Shields 1974).
Unlike oxygen, for nitrogen one usually can measure the singly-ionized
state only;
unfortunately, N++ has no strong optical lines. As discussed
in Section 2.1.3., the
nitrogen abundance is basically derived from [N II] / [O II].
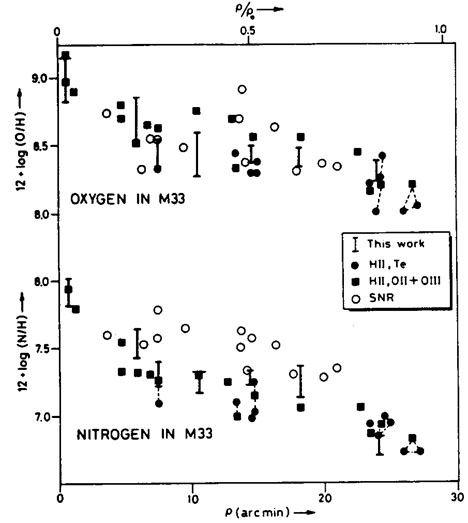
Figure 3, from
Vilchez et
al. (1988),
shows the O/H and N/H gradients for M 33. The relative behavior of O and
N is often displayed by plotting N/O vs. O/H. Some studies find that N/O
varies almost as
steeply as O/H, which has special significance in the context of
chemical evolution models
(see Section 3.4.), but others claim that N/O varies
only slightly or is constant across the
disks of galaxies such as M 101, M 33, M 81, and M 83 (references given
above). There also appear to be variations in N/O at a given O/H from
galaxy to galaxy (e.g.
Webster and Smith
1983).
Some of these variations may be an artifact of the analysis, especially
since
N+ contains only a small fraction of the nitrogen for the
lowest-abundance, most highly
ionized regions. For such regions, the ionization correction factors
(Section 2.1.3.) are
very large, and the uncertainties in the ionization structure translate
into large uncertainties
in the elemental abundance of nitrogen. Nevertheless, there is
accumulating evidence that
nitrogen has a more complicated behavior than does oxygen, with N/O
being roughly
constant at low values of O/H and increasing at higher O/H (e.g.
Pagel 1985;
Torres-Peimbert,
Peimbert, and Fierro 1989).
Measurements of N/O in metal-poor dwarf irregular
galaxies are an important ingredient in this argument (see
Section 4.5.).
, which decreases with
increasing distance from the centers of spiral
galaxies. Although part of this trend is due to the generally lower
degree of ionization in
the outer H II regions, there also must be a real variation in abundance
(e.g.
Shields 1974).
Unlike oxygen, for nitrogen one usually can measure the singly-ionized
state only;
unfortunately, N++ has no strong optical lines. As discussed
in Section 2.1.3., the
nitrogen abundance is basically derived from [N II] / [O II].
Figure 3, from
Vilchez et
al. (1988),
shows the O/H and N/H gradients for M 33. The relative behavior of O and
N is often displayed by plotting N/O vs. O/H. Some studies find that N/O
varies almost as
steeply as O/H, which has special significance in the context of
chemical evolution models
(see Section 3.4.), but others claim that N/O varies
only slightly or is constant across the
disks of galaxies such as M 101, M 33, M 81, and M 83 (references given
above). There also appear to be variations in N/O at a given O/H from
galaxy to galaxy (e.g.
Webster and Smith
1983).
Some of these variations may be an artifact of the analysis, especially
since
N+ contains only a small fraction of the nitrogen for the
lowest-abundance, most highly
ionized regions. For such regions, the ionization correction factors
(Section 2.1.3.) are
very large, and the uncertainties in the ionization structure translate
into large uncertainties
in the elemental abundance of nitrogen. Nevertheless, there is
accumulating evidence that
nitrogen has a more complicated behavior than does oxygen, with N/O
being roughly
constant at low values of O/H and increasing at higher O/H (e.g.
Pagel 1985;
Torres-Peimbert,
Peimbert, and Fierro 1989).
Measurements of N/O in metal-poor dwarf irregular
galaxies are an important ingredient in this argument (see
Section 4.5.).
|
Figure 3. The O/H and N/H gradients in M 33, reprinted from Vilchez et al. (1988). |
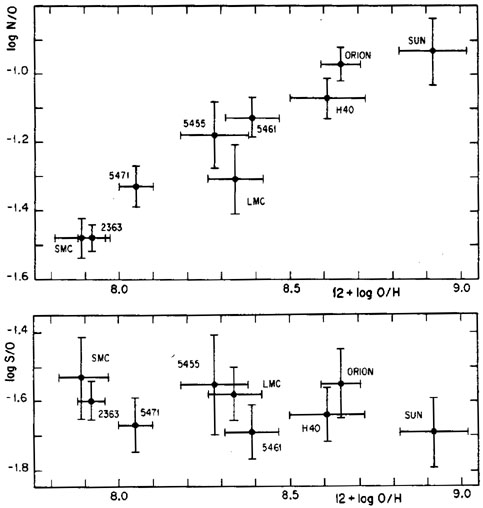
3.3.2. Sulfur. Another element with bright optical emission lines is sulfur, but it suffers from a similar problem as does nitrogen. In most studies to date, sulfur abundances have been determined from [S II] 6717, 6731Å. Comparison of these lines with [N II], [O II] yields values for S/N and S/O. Unfortunately, the ionization potential of S+ is lower than those of N+ or O+, SO that one should really measure S++ as well, in order to estimate the elemental abundance ratio (e.g. Hawley and Grandi 1977). In fact, the S+ ion is present outside the Strömgren sphere, and the [S II] emission comes primarily from the H+ / H0 transition zone (Shields 1974). As a result, abundances derived from [S II] alone are very sensitive to the procedure used to correct for the ionization structure. Discrepant results have been reported by different authors for the same H II regions. For example, Evans (1986) reports that S/O increases as O/H decreases in M101, while for the same galaxy, Torres-Peimbert, Peimbert, and Fierro (1989) find S/O to be constant. Figure 4 reproduces the N/O and S/O vs. O/H variations reported by the latter authors for M 101.
|
Figure 4. The relative abundance ratios N/O and S/O vs. O/H in M 101, from Torres-Peimbert, Peimbert, and Fierro (1989). |
Progress in determinations of sulfur abundances probably will require much more extensive measurements of S++. This ion can be sampled either via the weak [S III] 6312Å line, which is the temperature-sensitive analog to [O III] 4363Å, or through the strong lines at 9069, 9532Å. It is preferable to use the latter both because of their intrinsic strengths and their gentler dependence on temperature. These lines fall in a spectral region only recently opened up by CCD detectors, and potentially suffer from absorption by telluric water vapor, but are beginning to be observed (Vilchez and Pagel 1988; Garnett 1989a, b) and probably offer the best prospect for improved sulfur abundances. When comparing results on sulfur abundances from different studies one should be aware of the lines observed and the method of analysis employed. Because of its fine-structure in ground term, S++ can behave as a "thermostat" in a similar way as O++, and is the major coolant in low-ionization regions such as those in the inner parts of galaxy disks (Mathis 1985).
3.3.3. Neon and Argon. Although they do have emission lines in the optical spectral region, abundance determinations for neon and argon in extragalactic H II regions are much rarer than for the elements discussed above. For Ne, the abundances are usually derived from [Ne III] 3869, 3889Å Although Ne+ is the majority ion in most H II regions, except for those ionized by the very hottest stars, the assumption that the Ne++ / Ne fraction is similar to O++/O is borne out by nebular models. Argon is a more difficult case. The strongest optical line is [Ar III] 7136Å; [Ar IV] 4711, 4740Å are weak lines and blended with other species, and [Ar II] 7.0 µm falls in the infrared. Attempts to find simple formulas for argon based on ionization potentials have not been very successful, so most recent studies based their ionization corrections on nebular models. The results show fairly large scatter, but most studies conclude that the observations are consistent with constant values for Ne/O and Ar/O (e.g. Torres-Peimbert, Peimbert, and Fierro 1989).
3.4. Comparison with the Galactic Abundance Gradient
Because of interstellar extinction, one can use the same techniques as
for extragalactic H II
regions only for the part of our Galaxy outside a galactocentric
distance of about 7 kpc (for RG = 10 kpc). Studies such as
those of
Hawley (1978)
found gradients similar to those in
other spirals, log(O/H) /
R = -.04 to -.06 dex/kpc and
log(N/H) /
R = -.10 dex/kpc.
Determination of abundances in the inner galaxy requires the use of
other techniques, such
as measuring electron temperatures from radio recombination lines. The
values of Te are
found to increase systematically with increasing RG,
presumably because of a decreasing
abundance of oxygen, the primary coolant. The inferred gradient in O/H
from the most recent major survey of this kind is
log(O/H) /
R = -.07 dex/kpc
(Shaver et
al. 1983).
The results from optical studies for the other measurable elements are similar to those for other galaxies: N/H varies more steeply than O/H (hence, N/O varies); S/O, Ne/O, and Ar/O do not vary in the outer part of the Galactic disk (Shaver et al. 1983 and references therein). Again, the optical studies are restricted to the unobscured portion of the Milky Way galaxy, and therefore do not sample the inner disk where the inferred O/H values are high. A more recent development, made possible by improvements in infrared detectors and the availability of a stratospheric platform, NASA's Kuiper Airborne Observatory (KAO), is the exploration of the infrared spectral region as a tool for studying the galactic abundance gradient (see the review of Herter 1989). The mid-infrared spectral region (5-30 µm) contains emission lines of the major ions of Ar, S, and Ne: [Ar II] 7.0 and [Ar III] 9.0 µm; [S III] 18 and [S IV] 10.5 µm; and [Ne II] 12.8 µm. These lines have been measured in a number of H II regions in the inner Galaxy, and evidence for abundances elevated by factors of two or three have been found for the Galactic Center (Lester et al. 1981), and for H II regions in the 5 kpc "ring" region (Pipher et al. 1984).
However, even these mid-infrared lines suffer somewhat from extinction. In particular, the [Ar III] and [S IV] lines fall in the middle of the strong 10 µm silicate absorption feature, where the optical depth is comparable to that in the near-infrared. Another approach to studying abundances in the inner galaxy is to make use of the fine-structure lines of [O III] 52, 88 µm and [N III] 57 µm. By a happy coincidence, these lines from the abundant and (presumably) usually co-extensive O++ and N++ ions fall close together in wavelength and have fairly similar dependences on the electron density. The line emissivities are also essentially independent of the electron temperature. Measurements of these three lines therefore yield a relatively accurate value for the N/O ratio (Watson et al. 1981; Lester et al. 1983). A survey of about a dozen galactic H II regions in these lines yielded strong evidence that N/O in the Galactic Center and 5 kpc "ring" is elevated by a factor of 2 or 3 as compared to the solar neighborhood (Lester et al. 1987). There remain some unsettled questions regarding N/O determinations from the far-infrared lines, including possible ionization structure effects in H II regions ionized by very cool stars (e.g. Rubin et al. 1988), and a systematic discrepancy between values derived from the infrared lines and those derived optically from [N II] / [O II] (Simpson et al. 1986). Nevertheless, this is clearly an area where further progress can be expected.
3.5. Comparison with Chemical Evolution Models
The recognition of significant variations in the gas composition within and among galaxies, along with parallel results on the stellar populations, inspired the development of chemical evolution models which attempt to explain these patterns (see reviews by Audouze and Tinsley 1976; Tinsley 1980; Clayton 1986; Pagel 1987). The so-called "simple model" postulates a closed system of gas and stars, which self-enriches in metals as generations of stars age, die, and seed the ambient gas in the heavy elements (Searle and Sargent 1972). This model also makes the approximations that the stellar lifetimes and timescale for complete mixing of nucleosynthetic products are negligible in comparison to the timescale on which the metallicity evolves ("instantaneous recycling"). The simple model makes a specific prediction regarding the metallicity and system properties: Z = y ln(Mtot / Mgas). In this equation, Z is the metal abundance, y is the fraction of the stellar mass converted to heavy elements (the "yield"), and Mtot = Mgas + Mstars. Although this model is most appropriate for the low-mass galaxies discusses in Section 4, it can also be applied to large disk galaxies if concentric radii are treated as independent zones. However, it does not explain the observed gradients, so modifications such as radial flows, matter exchange with an outside reservoir (infall and outflow), or a variable stellar initial mass function, have been proposed as modifications to the model (e.g. Güsten and Mezger 1982; Lacey and Fall 1985; Matteucci and Francois 1989; Dopita 1990).
The relative abundances of nitrogen and oxygen are of particular
interest, since they are
synthesized in different astrophysical sites. Oxygen is synthesized in
massive stars and
distributed into the interstellar medium by Type II supernovae, while
the origin of nitrogen
is more problematical. A distinction is frequently made between
"primary" nucleosynthetic
products, which can be synthesized directly from H and He in Population
III stars, and
"secondary" products, which require a "seed" heavy nucleus to be
initially present in the
star where its synthesis occurs. By this definition, oxygen is a primary
species. Nitrogen
is secondary when made as a by-product of CNO-cycle hydrogen
burning. According to
the simple closed-box model, the abundance of a secondary species is
quadratic, so that if
N is secondary and O primary, then (N/H)
 (O/H)2, or (N/O)
(O/H). The N/O ratio
does appear to approach this behavior, for H II regions with moderately
high O/H values in M 101
(Torres-Peimbert,
Peimbert, and Fierro 1989)
and in the Milky Way
(Lester et al. 1987).
However, below a certain values of O/H, it appears that N/O is constant;
these low-metallicity H II regions occur mostly in low-mass galaxies (see
Section 4.5.1.). Thus, it is
becoming clear that nitrogen is not purely a secondary nucleosynthetic
product. Indeed, N
may be produced within intermediate-mass stars by an effectively primary
process, if C
synthesized within the star by the triple-alpha reaction is later
subjected to the CN cycle
(Alloin et al. 1979;
Renzini and Voli
1981).
Nitrogen made by this process would be
primary, but there might be a time-delay in building up its abundance
relative to the nuclear
products of supernovae, because of the longer lifetimes of the source
stars
(Edmunds and Pagel
1978;
Serrano and Peimbert
1983;
Diaz and Tosi 1986).
(O/H)2, or (N/O)
(O/H). The N/O ratio
does appear to approach this behavior, for H II regions with moderately
high O/H values in M 101
(Torres-Peimbert,
Peimbert, and Fierro 1989)
and in the Milky Way
(Lester et al. 1987).
However, below a certain values of O/H, it appears that N/O is constant;
these low-metallicity H II regions occur mostly in low-mass galaxies (see
Section 4.5.1.). Thus, it is
becoming clear that nitrogen is not purely a secondary nucleosynthetic
product. Indeed, N
may be produced within intermediate-mass stars by an effectively primary
process, if C
synthesized within the star by the triple-alpha reaction is later
subjected to the CN cycle
(Alloin et al. 1979;
Renzini and Voli
1981).
Nitrogen made by this process would be
primary, but there might be a time-delay in building up its abundance
relative to the nuclear
products of supernovae, because of the longer lifetimes of the source
stars
(Edmunds and Pagel
1978;
Serrano and Peimbert
1983;
Diaz and Tosi 1986).
The other elements measured in extragalactic H II regions, S, Ne, and Ar, are not likely to be dominated by secondary processes. They might still, however, vary differently than oxygen, if they were produced in stars of different mass ranges and the initial mass function varied or the timescales for enrichment differed substantially. There are known variations in the abundance ratios of certain elements. For example the fact that the iron-group is deficient relative to oxygen in Population II stars is thought to reflect an origin for the former chiefly in Type I supernovae, which originate in long-lived progenitors, as opposed to synthesis of oxygen in massive stars and Type II supernovae. For a recent review of this subject see Wheeler, Sneden, and Truran (1989).