Copyright © 1994 by Annual Reviews. All rights reserved
| Annu. Rev. Astron. Astrophys. 1994. 32:
227-275 Copyright © 1994 by Annual Reviews. All rights reserved |


5.1 Integrated Spectra of Galaxies
The spectra of galaxies are primarily those of the underlying stellar population (absorption lines) with the addition of nebular emission lines from the GH II and young starburst regions which are present if recent star formation has occurred. We first consider how one might infer the distribution of massive stars from the nebular line analyses, and then discuss spectral synthesis of the stellar features.
5.1.1 NEBULAR LINE ANALYSES
The number of exciting stars of ionized hydrogen regions (NO*) can
readily be estimated from analysis of the emission line spectra
(e.g.
Kennicutt 1984,
Shields 1990).
One observes the spatially
integrated H flux (or the
H
flux (or the
H or radio
recombination measure),
accounts for the extinction (if necessary), and from simple
recombination theory infers the total number of Lyman continuum
photons (N Lyc) being emitted. This last step contains the nominal
nebular analysis assumptions of "Case B" - no dust, and ionization
bounded. The N Lyc is a direct measure of the number of exciting
stars. The total number released is a product of the numbers of hot
stars, the slope of the IMF, and the N Lyc at each spectral subtype.
or radio
recombination measure),
accounts for the extinction (if necessary), and from simple
recombination theory infers the total number of Lyman continuum
photons (N Lyc) being emitted. This last step contains the nominal
nebular analysis assumptions of "Case B" - no dust, and ionization
bounded. The N Lyc is a direct measure of the number of exciting
stars. The total number released is a product of the numbers of hot
stars, the slope of the IMF, and the N Lyc at each spectral subtype.
Vacca (1992,
1994)
has thoroughly reviewed and quantified this
procedure. He introduces the parameter
 0 as
defined in the equation
0 as
defined in the equation
| (3) |
where N O7V is the number of "equivalent" O7V type stars, and
NO* is
the total number of O stars. The N O7V is simply the observed
N Lyc
divided by the number of Lyman continuum photons emitted by an O7V
star (1 × 1049 s-1). The
0 can
be calculated as a function of
 , Teff,
and log g using the Kurucz stellar atmosphere models. Its value,
tabulated by Vacca, depends also on Mupper, and the
Mlower for Lyman
photon production - roughly the OB star boundary. This latter
parameter depends on the metal abundance Z via the stellar structure
models. This procedure makes the assumption that all O stars in H II
and GH II regions are main sequence; one can separately allow for
massive star evolution.
, Teff,
and log g using the Kurucz stellar atmosphere models. Its value,
tabulated by Vacca, depends also on Mupper, and the
Mlower for Lyman
photon production - roughly the OB star boundary. This latter
parameter depends on the metal abundance Z via the stellar structure
models. This procedure makes the assumption that all O stars in H II
and GH II regions are main sequence; one can separately allow for
massive star evolution.
How accurately does this method work? It has been calibrated using
30 Dor in the LMC. Parker
(1992,
1993) and
Parker & Garmany
(1993)
have made a detailed census of the hot star population in an 7' × 7'
area centered on R136. They find about 400 O stars. Vacca
(1992,
1994)
has analyzed the nebular spectrum of a trailed, 15-minute
spectrophotometric exposure of an 8' × 8' area scan centered on R136
(taken by M. Phillips). Using the Z value for the LMC and Parker's
value for (- 1.4), he finds
0 to be
0.44 and estimates that about
330 O stars are present, within 30% of the actual count (allowing for
the slight difference in areas)! This gives us confidence in the
procedure which has been applied to W-R and other emission line
galaxies by
Vacca & Conti (1992)
as we show below (Section 5.1.4).
5.1.2 EMISSION LINE GALAXIES - STARBURSTS These galaxies with emission line spectra like those of H II regions were noted by Sargent & Searle (1970). Given the often substantial numbers of O-type stars found within these galaxies, they can be understood to be examples of very young "starbursts." Using slit spectroscopy, one may obtain the numbers of exciting stars by a procedure similar to that outlined above for 30 Dor. For galaxies, however, we might have additional complications if the slit width does not include the entire region of interest, if the nebulosity is density bounded, or if dust is present in sufficient quantities to absorb a considerable fraction of the Lyman photons.
5.1.3 STARBURST MODELS
Several models for starburst populations have been produced to
simulate various properties of the galaxy spectra such as: the overall
stellar and nebular spectrum
(Leitherer 1990,
1991;
Leitherer et at 1992b;
Bernlohr 1992,
1993),
the strengths of the Si IV and CIV UV
wind features emitted by O stars
(Leitherer & Lamers
1991;
Mas-Hesse & Kunth
1991a,
b),
the widths of these UV lines
(Robert et al 1993),
the far-infrared and radio emission by the dust
(Mas-Hesse 1992,
Desert 1993),
the emission line ratios such as
 4686 He II /
H or the
so-called W-R "bump" 4650
/ H
(Arnault et al 1989,
Meynet 1994b),
or other line ratios such as
4686He II /
4650CIII, which is sensitive to
the WN/WC ratio
(Kruger et al 1992).
4686 He II /
H or the
so-called W-R "bump" 4650
/ H
(Arnault et al 1989,
Meynet 1994b),
or other line ratios such as
4686He II /
4650CIII, which is sensitive to
the WN/WC ratio
(Kruger et al 1992).
The basic physical parameters for a starburst model are the star formation rate - in particular the intensity and duration of the burst, the age after its beginning, the IMF, and Z. The hope of starburst models is to disentangle these various parameters. Let us consider the didactical, but not unrealistic, case of an instantaneous "burst" (formation over a time of up to 1 Myr - small with respect to the massive star evolution time). In this case, an evolved W-R population with its prominent emission features results from only a part of the mass range of the potential W-R progenitors, while in the case of a constant SFR the W-R population results from an equilibrium mixture of the whole potential mass range. We may schematically distinguish four different epochs in the evolution of a burst according to recent models of massive stars and W-R stars (Maeder & Meynet 1994):
 2 Myr, massive stars are in
their O-type
phase, giving rise to H II regions without W-R features.
2 Myr, massive stars are in
their O-type
phase, giving rise to H II regions without W-R features.
 and
Z, the more numerous are the WC stars. At lower Z and
, single star
evolution only leads to WNL stars and very few WC stars, but we may
also expect (Section 4.5.2) a fraction
of W-R stars of WNE type from RLOF binary evolution.
and
Z, the more numerous are the WC stars. At lower Z and
, single star
evolution only leads to WNL stars and very few WC stars, but we may
also expect (Section 4.5.2) a fraction
of W-R stars of WNE type from RLOF binary evolution.
 7 Myr, the W-R stars have
disappeared but
at up to 10 Myr there are still O-type stars to produce H II region
nebular emission line features. One way to distinguish between this
phase and the first O-phase might be to examine the equivalent width
of H nebula
emission; according to
Copetti et al (1986)
this parameter steadily decreases in value with age in model H II regions
(while the number of Lyc photons remains more or less steady, the
starlight at 4860 steadily
increases).
7 Myr, the W-R stars have
disappeared but
at up to 10 Myr there are still O-type stars to produce H II region
nebular emission line features. One way to distinguish between this
phase and the first O-phase might be to examine the equivalent width
of H nebula
emission; according to
Copetti et al (1986)
this parameter steadily decreases in value with age in model H II regions
(while the number of Lyc photons remains more or less steady, the
starlight at 4860 steadily
increases).
During these phases of a burst, the various ratios of W-R subtypes to O stars are much larger than in the case of a constant SFR. As an example, at solar Z the average WNL/O ratio is up to six times larger, and the enhancement is even greater at lower Z. The reason is that the duration of the W-R-rich phase is shorter at lower Z, meaning that stars of only a narrow mass range become W-R stars, thus the contrast between the cases of a burst and of constant SFR is much larger. For bursts longer than 1 Myr, the situation is intermediate between the instantaneous burst and constant SFR. We also notice that if an observed H II region consists of a burst plus a region of lower but constant SFR, we have for the 2 Myr after the burst a much lower W-R/O ratio than for constant SFR, since at this time the W-R stars from the burst have not yet appeared. On the whole, then, one must he cautious before making quantitative inferences from number ratios alone.
5.1.4 WOLF-RAYET GALAXIES
These are a subset of emission line galaxies in which, in addition to
the nebular line spectrum, one observes broad emission at
4686 Å due
to the presence of Wolf-Rayet stars
(Conti 1991a,
b,
and references therein). The starburst phenomena illustrated by W-R galaxies
represent an extreme burst of star formation, in which hundreds to
thousands (or more) of massive stars have been born. There are
currently about 50 examples of such systems, most of which have been
discovered serendipitously. Many are Markarian or Zwicky galaxies and
exhibit disturbed morphologies which may be the result of interactions
or mergers. Examples of W-R galaxies may be found among Blue Compact
Dwarf Galaxies
(Sargent 1970),
isolated extragalactic H II regions
(Sargent & Searle
1970),
dwarf irregulars
(Dinerstein & Shields
1986),
"amorphous" galaxies
(Walsh & Roy 1987),
spiral galaxies containing knots or GH II regions
(Keel 1982),
recent galaxy mergers
(Rubin et al 1990),
or powerful IRAS galaxies
(Armus et al 1988).
The broad emission features are seen in contrast to the galaxy stellar population continua. The dilution is such that the few hundred Å equivalent width of an emission line of typical single W-R stars is usually only a few Å in W-R galaxies. Examples of the spectra are given in Vacca & Conti (1992) and Conti (1993). Many of these galaxies are metal-weak but this may be a selection effect, given that starburst galaxies with more normal composition are likely to have a brighter underlying stellar population, which could "drown out" the W-R stars even if present.
Vacca & Conti (1992)
have recently analyzed optical spectra of ten
Wolf-Rayet and four other emission line galaxies. The nebular line
ratios indicate that the excitation is caused by stars. The strength
of the 4686 Å may be
used to infer the numbers of W-R stars present;
this uses a calibration of the line flux for single W-R stars in the
LMC, dividing that number into the measured line flux in the galaxy.
Typically, tens to hundreds of W-R stars are inferred to be present in
the starbursts. This procedure has been quantitatively checked by
using the area spectrophotometry of 30 Dor in which a broad
4686 He
II line is measured; the inferred numbers of W-R stars (20) are
similar to the census of
Moffat et al (1987).
The contribution of the
W-R stars to the observed N Lyc is subtracted from the observed value
for the galaxy, and the remainder is treated, as above, to determine
the number of O-type stars present. As it is not possible to derive
the slope of an IMF from this procedure, a
equivalent to that of
30 Dor was adopted for each galaxy; similarly the
was assumed to be the
same (100 M ).
With the usual assumptions that low mass stars have
formed along with the high mass ones, typical star formation rates
range from 2 × 10⁻² to 3
M per year
(the former is the value for 30 Dor).
).
With the usual assumptions that low mass stars have
formed along with the high mass ones, typical star formation rates
range from 2 × 10⁻² to 3
M per year
(the former is the value for 30 Dor).
Following the nebular line analysis taken for 30 Dor,
spectrophotometric studies have provided quantitative values of WNL/O
for W-R galaxies
(Vacca & Conti 1992,
Conti 1993).
Figure 3 shows the
comparison of these observations with continuous star formation and
newly constructed burst models
(Meynet 1994b;
see also
Maeder & Meynet 1994).
The observed WNL/O ratios in W-R galaxies are much higher than
the predictions of models with constant SFR, in agreement with
previous estimates
(Arnault et al 1989).
In Figure 3, burst models
with two different IMF slopes are shown which bracket the observations
nicely. Notice also the importance of Z to the predictions. The
observed values are, strictly speaking, the number of WN stars derived
from the strength of 4686
He II, but in most of these W-R galaxies,
there is little or no evidence of WC stars. The largest source of
uncertainty in the observed values is a possible mismatch between the
slit width (1.5") and the starburst (typically 2 to 3"). This
underestimates the number of O stars. Arbitrarily correcting for this
would lower the ratio by a factor 2 (see a more thorough discussion in
Conti 1993).
W-R binaries might enhance the production of W-R stars, but this
effect is believed to be small except at the lowest Z. While
Masegosa et al (1991)
suggest that SN contamination could affect the starburst
properties, particularly the "blue bump" at
4650, this may be
unimportant as no other effects (e.g. shocks) are seen in the nebular
spectra of W-R galaxies
(Vacca & Conti 1992).
Could there be different
values for in various
starburst regions? This possibility has been
raised in recent years
(Scalo 1990;
Mas-Hesse & Kunth
1991a,
b;
Rieke 1991;
Joseph 1991;
Bernlohr 1993).
We have already noted (Section 2)
that in regions where the O star populations can be counted directly,
does appear to differ from
region to region by a small, but significant amount. Thus differences in
from starburst region to
starburst region are possible, but final conclusions are still uncertain.
|
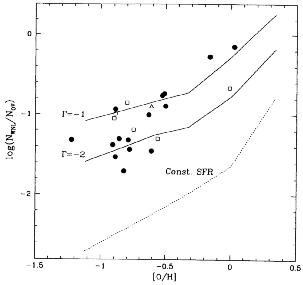
Figure 3. WNL/OV ratio in W-R galaxies, as
a function of the oxygen abundance [O/H]; data adapted from
Conti (1993);
stellar models from
Maeder & Meynet
(1994).
(bullet) Galaxies of
Vacca & Conti (1992);
(square)
galaxies of W.D. Vacca (private communication); (triangle) 30 Dor (from
Vacca 1992).
The dotted line denotes the predictions for "continuous" star
formation; the solid lines are for values estimated for a "burst" (see
text). |
From Figure 3 we conclude that for W-R galaxies,
the W-R/O ratios
are well above the predictions for "continuous" star formation, and
nicely match the predictions of "burst" models. We infer that the
starbursts observed in W-R galaxies are typically going on for only a
relatively "brief" interval, typically
 106
yr. The energetics are
similar to 30 Doradus at the faint end to more than 100×
larger. Are
these nearby starbursts paradigms for the first phases of massive star
evolution in very young galaxies?
106
yr. The energetics are
similar to 30 Doradus at the faint end to more than 100×
larger. Are
these nearby starbursts paradigms for the first phases of massive star
evolution in very young galaxies?
Phillips & Conti (1992) discovered evidence for WC9 stars in a GH II region at the edge of the bar in the metal-rich (+0.5 dex) galaxy NGC 1365. As their spectrum only covered the yellow region, there is currently no information on the numbers of WN stars in their strong starburst region. However, the presence of late type WC stars in a strong Z environment nicely follows the models predictions (Section 4.5.3).
5.1.5 SPECTRAL SYNTHESIS
Optical spectroscopy of most galaxies shows absorption line spectra
from an old evolved population of late type giant stars. In the W-R
galaxies studied by
Vacca & Conti (1992)
the optical absorption
spectra are those of late B and A type stars (narrow K line, upper
Balmer series in absorption, no other features). In these objects,
even though there are large numbers of very hot stars, the optical
spectra are dominated by other stars. However, in the UV the O (and
W-R) stars become the dominant contributors to the continua. In
emission line galaxies containing OB stars, P Cygni spectral features
at 1400 Si IV and
1550 C IV are seen; if W-R
stars are present, an
emission line at 1640 He
II is found.
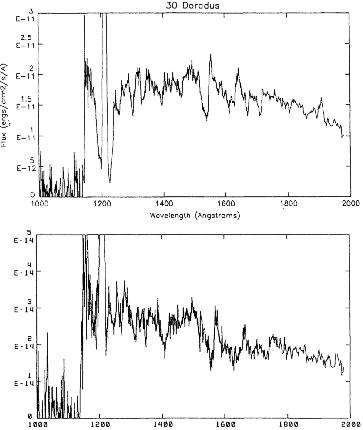
In Figure 4 we show IUE spectra of a 3' ×
3' area of the GH II
region 30 Dor in the LMC and NGC 1741, a W-R galaxy. UV spectra such
as these can be used directly to estimate the numbers of hot stars
present by spectral synthesis techniques
(Leitherer et al
1992a,
b;
Robert et al 1993).
One can also ascertain the age of the starburst
and tell whether or not the formation of the massive stars has been
"continuous" or a "burst": In work in progress,
Vacca et at (1994)
have found a reasonable fit for the Si IV, C IV, and He II profiles
for ages between 1.5 and 2 Myr for the UV spectrum of 30 Dor
illustrated in Figure 4. For younger ages,
insufficient W-R stars have been produced to match the
1640 emission line; for
older ages, the Si
IV and C IV profiles begin to diverge from the observations. It is
also possible to estimate the number of O stars from the
extinction-corrected IUE continuum of 30 Dor, as the models predict
this quantity. The agreement with the census from Parker
(1992,
1993) and
Parker & Garmany
(1993)
is good. Unfortunately, even the brightest
starburst galaxies are at the limit of IUE sensitivity. The 10"
× 20"
slit is typically larger than the starburst, so dilution of the
spectral signatures can be a problem. For the number counts, but not
for the age estimate, the UV extinction is critical and remains a
serious problem for more general application of this method.
|
Figure 4. Observed IUE SWP spectra
of
30 Dor (top) and NGC 1741
(bottom), a W-R galaxy. Stellar line features at
|
5.2.1 FAR-INFRARED LUMINOSITIES
Radiation from dusty H II and GH II regions and galaxies in the
far-infrared appears to come from heating of the dust by their stellar
populations.
Devereux & Young (1991)
have argued that the far-infrared
(FIR) luminosities relate directly to the content of hot stars. They
have derived the FIR luminosity of 124 spiral galaxies from the IRAS
archives, which also have
H measurements. From the
individual IRAS
colors, they find that this dust is at a temperature of 30 to 40 K,
corresponding to heating by hot stars: they suggest that ambient
heating by stars of all types would be more like 15-20 K. In their
Figure 5 they show a correlation between the FIR
and the H emission
extending over two orders of magnitude. Part of the dispersion in
their relation could come from the differences in Teff
of the exciting
stars. Although Devereux & Young claim that one can infer the actual
Teff values, we don't believe that the modeling used
is adequate.
With considerable caution, one could perhaps use the FIR
luminosities of star forming regions to infer the total numbers of hot
stars present, but, absent other information, one cannot infer an IMF
slope () or an
Mupper. The FIR luminosities for normal spiral galaxies
range from 109 to 1011
L and,
according to
Devereux & Young
(1991),
show no dependence on the Hubble type. This seems at odds with the
appearance of stellar images on direct plates. It would be nice to
confirm that the relationship between FIR luminosity and numbers of
hot exciting stars is as orderly as claimed. This might be
accomplished with identifications and counts of O type stars in
otherwise obscured GH II regions of our Galaxy, such as W51, through
classification K band spectroscopy
(Conti et al 1993).
5.2.2 IMAGING OF EMISSION LINE AND W-R GALAXIES Optical CCD photometry of galaxies is a growth industry: Spectral syntheses of the continua can give us valuable information on stellar populations of all but the hottest and most massive stars. As we have already noted, even in W-R galaxies, demonstrably the youngest examples of starburst phenomena, the optical light comes primarily from stars of type A. Thus in this wavelength region we are sampling stars with lifetimes (not necessarily ages) of 50 million years or more.
Conti & Vacca (1994)
have used the HST with FOC camera and the
2200
Å filter to obtain a UV image of the W-R galaxy He 2-10; the spatial
resolution with image restoration is
 0.1". At this
wavelength one is
primarily sampling the OB stars, which have lifetimes of a few ×
106
to 107 yr. Given the presence of W-R stars in this galaxy,
the age is
closer to the lower of those numbers. This W-R galaxy has recently
been found by
Corbin et al (1993),
using deep CCD photometry, to be at
the center of a faint elliptical galaxy (3 kpc diameter)! There are
three starburst regions, the strongest (containing W-R stars) at the
center. Figure 5 is a reconstructed HST UV image
of the central
starburst in He 2-10. One can see ten individual knots of activity,
several just at the limit of resolution (10 pc in diameter), with
separations of about two to three times this number.
0.1". At this
wavelength one is
primarily sampling the OB stars, which have lifetimes of a few ×
106
to 107 yr. Given the presence of W-R stars in this galaxy,
the age is
closer to the lower of those numbers. This W-R galaxy has recently
been found by
Corbin et al (1993),
using deep CCD photometry, to be at
the center of a faint elliptical galaxy (3 kpc diameter)! There are
three starburst regions, the strongest (containing W-R stars) at the
center. Figure 5 is a reconstructed HST UV image
of the central
starburst in He 2-10. One can see ten individual knots of activity,
several just at the limit of resolution (10 pc in diameter), with
separations of about two to three times this number.
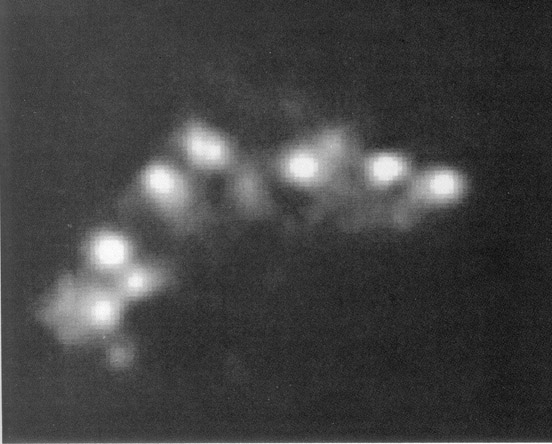
|
Figure 5. Reconstructed UV image of the central starburst in He2-10 (from Conti & Vacca 1994). Nine individual starburst knots are readily seen. The spatial scale across the figure is 3". corresponding to 125pc. The parent elliptical galaxy (Corbin et al 1993) is about 80" in diameter, which is much larger than the scale of this starburst. |
Conti & Vacca (1994)
estimate the average 2200
luminosities of the
individual starburst knots in He 2-10 to be
1038 erg
s-1 Å-1. This
corresponds to MV of -13.9, and mean total masses (assuming a normal
IMF) of a few × 105
M. These
masses are similar to those of globular
clusters, but in objects with ages of less than 10 Myr!
Whitmore et al (1993)
have recently identified about 40 blue objects in the galaxy
merger remnant NGC 7252 as being globular clusters of age about 500
Myr, on the basis of their optical colors and absolute
magnitudes. Their average MV are about one magnitude fainter than
those of He 2-10, which could be an evolution effect since the
starburst in NGC 7252 is older.
Conti & Vacca (1994) have noted that at least a dozen other W-R galaxies for which they have HST UV imaging also show multiple knots of star forming activity. The luminosities of the knots in several of these galaxies are substantially larger than those of He 2-10. Many of these other galaxies are clear examples of merging or interacting galaxies (the status of He 2-10 is not quite clear on this point). They thus suggest that galaxy merger events may lead to star formation episodes which produce knots of activity and eventual production of what we now recognize as globular clusters. Of course, it is not certain that where large numbers of massive stars have been produced, as in these starburst regions, low mass stars are also born. In nearby galactic associations we do consistently see a lower main sequence, but in highly energetic star formation episodes, this might not always be the case.