Published in Nuclear Physics B Proceedings Supplements,
Volume 87, Issue 1-3, p. 3-12, 2000.
astro-ph/0007187
COSMOLOGICAL PARAMETERS
Joel R. Primack
Physics Department,
University of California, Santa Cruz, CA 95064 USA
Abstract.
The cosmological parameters that I will emphasize are the Hubble
parameter H0
 100h km
s-1 Mpc-1, the age of the
universe t0, the average matter density
100h km
s-1 Mpc-1, the age of the
universe t0, the average matter density
 m, the baryonic
matter density b,
the neutrino density
m, the baryonic
matter density b,
the neutrino density  , and the
cosmological constant
, and the
cosmological constant  . The evidence currently favors
t0
. The evidence currently favors
t0  13
Gyr, h 0.65,
m
0.4 ± 0.1,
b =
0.02h-2, 0.001 <
< 0.1, and
0.7.
13
Gyr, h 0.65,
m
0.4 ± 0.1,
b =
0.02h-2, 0.001 <
< 0.1, and
0.7.
Table of Contents
 INTRODUCTION
- AGE OF THE UNIVERSE t0
- HUBBLE PARAMETER H0
- Relative Distance Methods
- Fundamental Physics Approaches
- Conclusions on H0
- HOT DARK MATTER DENSITY
- COSMOLOGICAL CONSTANT
- MEASURING
m
- CONCLUSION
- REFERENCES
1. INTRODUCTION
In this review I will concentrate on the values of the cosmological
parameters. The other key questions in cosmology today concern the
nature of the dark matter and dark energy, the origin and nature of
the primordial inhomogeneities, and the formation and evolution of
galaxies. I have been telling my theoretical cosmology students for
several years that these latter topics are their main subjects for
research, since determining the values of the cosmological parameters
is now mainly in the hands of the observers.
In discussing cosmological parameters, it will be useful to
distinguish between two sets of assumptions: (a) general relativity
plus the assumption that the universe is homogeneous and isotropic on
large scales (Friedmann-Robertson-Walker framework), or (b) the FRW
framework plus the CDM
family of models. In addition to the FRW
framework, the CDM models
assume that the present matter density
m plus the
cosmological constant (or its equivalent in ``dark
energy'') in units of critical density
=
/
(3 H02) sum to unity
(m +
= 1) to produce the
flat universe predicted by simple cosmic inflation models. These
CDM models assume that the
primordial fluctuations were adiabatic
(all components fluctuate together) and Gaussian, and had a Zel'dovich
spectrum (Pp(k) = A kn, with
n 1), and that the
dark matter is mostly of the cold variety.
Although the results from the Long-Duration BOOMERANG
[30,
75]
and the MAXIMA-1
[54,
5]
CMB observations and analyses
[59]
were were not yet available at
the Dark Matter 2000 conference, I have made use of them in preparing
this review. The table below summarizes the current observational
information about the cosmological parameters, with estimated
1 errors. The quantities in
brackets have been deduced using
at least some of the CDM
assumptions. The rest of this paper
discusses these issues in more detail. But it should already be
apparent that there is impressive agreement between the values of the
parameters determined by various methods.
errors. The quantities in
brackets have been deduced using
at least some of the CDM
assumptions. The rest of this paper
discusses these issues in more detail. But it should already be
apparent that there is impressive agreement between the values of the
parameters determined by various methods.
Table 1. Cosmological Parameters [results assuming
CDM in brackets]
|
| H0
| = 100 h km s-1 Mpc-1 ,
h = 0.65 ± 0.08
|
| t0
| = 9-16 Gyr (from globular clusters)
|
|
| = [9-17 Gyr from expansion age,
CDM models]
|
| b
| = (0.045 ± 0.0057) h65-2 (from D/H)
|
|
| > [0.04 h65-2 from
Ly forest opacity] forest opacity]
|
| m
| = 0.4 ± 0.2 (from cluster baryons)
|
|
| = [0.34 ± 0.1 from Ly
forest P(k)]
|
|
| = [0.4 ± 0.2 from cluster evolution]
|
|
| > 0.3 (2.4, from
cosmic flows)
|
|
| = [0.5 ± 0.1 from flows plus SN Ia]
|
|
| 3/4
- 1/4 ± 1/8 from SN Ia
|
| m +
| = 1.11 ± 0.07 (from CMB peak location)
|
|
| = 0.71 ± 0.14 (from previous two lines)
|
|
| < & 0.73 (2) from radio
QSO lensing
|
|
|  0.001 (from
Superkamiokande) 0.001 (from
Superkamiokande)
|
|
|  [0.1] [0.1]
|
|
2. AGE OF THE UNIVERSE t0
The strongest lower limits for t0 come from studies of
the stellar
populations of globular clusters (GCs). In the mid-1990s the best
estimates of the ages of the oldest GCs from main sequence turnoff
magnitudes were tGC
15 - 16 Gyr
[15,
124,
23].
A frequently quoted lower limit on the age of GCs was 12 Gyr
[23],
which was then an even more conservative lower limit on
t0 = tGC +
 tGC,
where
tGC> ~ 0.5 Gyr is
the time from the Big Bang until GC formation. The main uncertainty in
the GC age estimates came from the uncertain distance to the GCs: a
0.25 magnitude error in the distance modulus translates to a 22%
error in the derived cluster age
[22].
tGC,
where
tGC> ~ 0.5 Gyr is
the time from the Big Bang until GC formation. The main uncertainty in
the GC age estimates came from the uncertain distance to the GCs: a
0.25 magnitude error in the distance modulus translates to a 22%
error in the derived cluster age
[22].
In spring of 1997, analyses of data from the Hipparcos astrometric
satellite indicated that the distances to GCs assumed in obtaining the
ages just discussed were systematically underestimated
[101,
51].
It follows that their stars at the main sequence
turnoff are brighter and therefore younger. Stellar evolution
calculation improvements also lowered the GC age estimates. In light
of the new Hipparcos data, Chaboyer et al.
[24]
have done a
revised Monte Carlo analysis of the effects of varying various uncertain
parameters, and obtained tGC = 11.5±1.3 Gyr
(1), with
a 95% C.L. lower limit of 9.5 Gyr. The latest detailed analysis
[20]
gives tGC = 11.5±2.6 Gyr from main sequence
fitting using parallaxes of local subdwarfs, the method used in
[101,
51].
These authors get somewhat smaller GC distances when
all the available data is used, with a resulting
tGC = 12.9±2.9 Gyr (95% C.L.). However, if main
sequence fitting is the more
reliable method, the younger age may be more appropriate.
Stellar age estimates are of course based on stellar evolution
calculations, which have also improved significantly. But the solar
neutrino problem reminds us that we are not really sure that we
understand how even our nearest star operates; and the sun plays an
important role in calibrating stellar evolution, since it is the only
star whose age we know independently (from radioactive dating of early
solar system material). An important check on stellar ages can come
from observations of white dwarfs in globular and open clusters
[102].
What if the GC age estimates are wrong for some unknown reason? The
only other non-cosmological estimates of the age of the universe come
from nuclear cosmochronometry - radioactive decay and chemical
evolution of the Galaxy - and white dwarf cooling. Cosmochronometry
age estimates are sensitive to a number of uncertain issues such as
the formation history of the disk and its stars, and possible actinide
destruction in stars
[79,
82].
However, an independent cosmochronometry age estimate
of 15.6±4.6 Gyr has been obtained based on data from two
low-metallicity stars, using the measured radioactive depletion of
thorium (whose half-life is 14.2 Gyr) compared to stable heavy
r-process elements
[27,
28].
This method could
become very important if it were possible to obtain accurate
measurements of r-process element abundances for a number of very low
metallicity stars giving consistent age estimates, and especially if
the large errors could be reduced.
Independent age estimates come from the cooling of white dwarfs in the
neighborhood of the sun. The key observation is that there is a lower
limit to the luminosity, and therefore also the temperature, of nearby
white dwarfs; although dimmer ones could have been seen, none have
been found (cf. however
[53]).
The only plausible
explanation is that the white dwarfs have not had sufficient time to
cool to lower temperatures, which initially led to an estimate of
9.3±2 Gyr for the age of the Galactic disk
[130].
Since there was evidence, based on the pre-Hipparcos GC distances,
that the stellar disk of our Galaxy is about 2 Gyr younger than the
oldest GCs (e.g.,
[121,
108]),
this in turn gave an estimate of the age of the universe of
t0
11±2 Gyr. Other analyses
[132,
56]
conclude that sensitivity to disk star formation history,
and to effects on the white dwarf cooling rates due to C/O separation
at crystallization and possible presence of trace elements such as
22Ne, allow a rather wide range of ages for the disk of about
10±4 Gyr. One determination of the white dwarf luminosity
function, using white dwarfs in proper motion binaries, leads to a
somewhat lower minimum luminosity and therefore a somewhat higher
estimate of the age of the disk of ~ 10.5+2.5-1.5 Gyr
[88].
More recent observations
[76]
and analyses
[9]
lead to an estimated age of the galactic disk of 8±1.5 Gyr.
We conclude that t0
13 Gyr, with ~ 10 Gyr a likely
lower limit. Note that t0 > 13 Gyr implies that
h  0.50 for
matter density
m = 1, and that
h 0.73 even for
m as small as 0.3
in flat cosmologies (i.e., with
m + = 1).
0.50 for
matter density
m = 1, and that
h 0.73 even for
m as small as 0.3
in flat cosmologies (i.e., with
m + = 1).
3. HUBBLE PARAMETER H0
The Hubble parameter H0
100h km s-1 Mpc-1 remains
uncertain, although no longer by the traditional factor of two. The
range of h determinations has been shrinking with time
[64].
De Vaucouleurs long contended that
h 1. Sandage has long
contended that
h 0.5, although a
recent reanalysis of the
Type Ia supernovae (SNe Ia) data coauthored by Sandage and Tammann
[111]
concludes that the latest data are consistent with
h = 0.6±0.04.
The Hubble parameter has been measured in two basic ways: (1)
Measuring the distance to some nearby galaxies, typically by measuring
the periods and luminosities of Cepheid variables in them; and then
using these ``calibrator galaxies'' to set the zero point in any of
the several methods of measuring the relative distances to
galaxies. (2) Using fundamental physics to measure the distance to
some distant object(s) directly, thereby avoiding at least some of the
uncertainties of the cosmic distance ladder
[109].
The difficulty with method (1) was that there was only a handful of
calibrator galaxies close enough for Cepheids to be resolved in
them. However, the HST Key Project on the Extragalactic Distance Scale
has significantly increased the set of calibrator galaxies. The
difficulty with method (2) is that in every case studied so far, some
aspect of the observed system or the underlying physics remains
somewhat uncertain. It is nevertheless remarkable that the results of
several different methods of type (2) are rather similar, and indeed
not very far from those of method (1). This gives reason to hope for
convergence.
3.1. Relative Distance Methods
One piece of good news is that the several methods of measuring the
relative distances to galaxies now mostly seem to be consistent with
each other. These methods use either ``standard candles'' or empirical
relations between two measurable properties of a galaxy, one
distance-independent and the other distance-dependent. The favorite
standard candle is SNe Ia, and observers are now in good agreement.
Taking account of an empirical relationship between the SNe Ia light
curve shape and maximum luminosity leads to
h = 0.65±0.06
[103],
h = 0.64+0.08-0.06
[61], or
h = 0.63±0.03
[52,
93],
and the slightly lower value mentioned
above from the latest analysis coauthored by Sandage and Tammann
agrees within the errors. The HST Key Project result using SNe Ia is
h = 0.65±0.02±0.05, where the first error quoted is
statistical and the second is systematic
[50],
and their Cepheid metallicity-dependent luminosity-period relationship
[65]
has been used (this lowers h by 4%). Some of the other relative
distance methods are based on old stellar populations: the tip of the
red giant branch (TRGB), the planetary nebula luminosity function
(PNLF), the globular cluster luminosity function (GCLF), and the
surface brightness fluctuation method (SBF). The HST Key Project
result using these old star standard candles is
[43]
h = 0.66±0.04±0.06, including the Cepheid metallicity
correction. The old
favorite empirical relation used as a relative distance indicator is
the Tully-Fisher relation between the rotation velocity and luminosity
of spiral galaxies. The ``final'' value of the Hubble constant from
the HST Key Project taking all of these into account, including the
metallicity dependence of the Cepheid period-luminosity relation, is
[45]
h = 0.74±0.04±0.07, where the first error is
statistical and the second is systematic. The largest source of
systematic uncertainty is the distance to the LMC, which is here
assumed to have a distance modulus of 18.45. This is a significantly
higher h than their previous
[85]
h = 0.71±0.06, or
h = 0.68±0.06 including the Cepheid metallicity dependence, using a
LMC distance modulus of 18.5.
3.2. Fundamental Physics Approaches
The fundamental physics approaches involve either Type Ia or Type II
supernovae, the Sunyaev-Zel'dovich (S-Z) effect, or gravitational
lensing of quasars. All are promising, but in each case the relevant
physics remains somewhat uncertain.
The 56Ni radioactivity method for determining
H0 using Type Ia
SNe avoids the uncertainties of the distance ladder by calculating the
absolute luminosity of Type Ia supernovae from first principles using
plausible but as yet unproved physical models for 56Ni
production. The first result obtained was that
h = 0.61±0.10
[3,
17];
however, another study
[77]
(cf. [126])
found that
uncertainties in extinction (i.e., light absorption) toward each
supernova increases the range of allowed h. Demanding that the
56Ni radioactivity method agree with an expanding photosphere
approach leads to h = 0.60+0.14-0.11
[86].
The expanding photosphere method compares the expansion rate of the SN
envelope measured by redshift with its size increase inferred from its
temperature and magnitude. This approach was first applied to Type II
SNe; the 1992 result h = 0.6±0.1
[114]
was subsequently revised upward by the same authors to
h = 0.73±0.06±0.07
[115].
However, there are various complications with the physics of the
expanding envelope
[110,
35].
The S-Z effect is the Compton scattering of microwave background
photons from the hot electrons in a foreground galaxy cluster. This
can be used to measure H0 since properties of the cluster gas
measured via the S-Z effect and from X-ray observations have different
dependences on H0. The result from the first cluster
for which
sufficiently detailed data was available, A665 (at z = 0.182), was
h = (0.4 - 0.5)±0.12
[13];
combining this with data on A2218 (z = 0.171) raised this somewhat to
h = 0.55±0.17
[12].
The history and more recent data have been reviewed by Birkinshaw
[14],
who concludes that the available data give a Hubble parameter
h 0.6 with a
scatter of about 0.2. But since the available measurements are not
independent, it does not follow that
h = 0.6±0.1; for example, there
is a selection effect that biases low the h determined this way.
Several quasars have been observed to have multiple images separated
by  ~ a few arc seconds; this
phenomenon is interpreted as
arising from gravitational lensing of the source quasar by a galaxy
along the line of sight (first suggested by
[100];
reviewed in
[129]).
In the first such system discovered, QSO 0957+561 (z = 1.41), the
time delay t between
arrival at the
earth of variations in the quasar's luminosity in the two images has
been measured to be, e.g., 409±23 days
[89],
although other authors found a value of 540±12 days
[94].
The shorter t has
now been confirmed
[72,
117].
Since t
2
H0-1, this
observation allows an estimate of the Hubble parameter. The latest
results for h from 0957+561, using all available data, are
h = 0.64±0.13 (95% C.L.)
[72],
and h = 0.62±0.07
[39],
where the error does not include systematic
errors in the assumed form of the lensing mass distribution.
~ a few arc seconds; this
phenomenon is interpreted as
arising from gravitational lensing of the source quasar by a galaxy
along the line of sight (first suggested by
[100];
reviewed in
[129]).
In the first such system discovered, QSO 0957+561 (z = 1.41), the
time delay t between
arrival at the
earth of variations in the quasar's luminosity in the two images has
been measured to be, e.g., 409±23 days
[89],
although other authors found a value of 540±12 days
[94].
The shorter t has
now been confirmed
[72,
117].
Since t
2
H0-1, this
observation allows an estimate of the Hubble parameter. The latest
results for h from 0957+561, using all available data, are
h = 0.64±0.13 (95% C.L.)
[72],
and h = 0.62±0.07
[39],
where the error does not include systematic
errors in the assumed form of the lensing mass distribution.
The first quadruple-image quasar system discovered was PG1115+080.
Using a recent series of observations
[113],
the time delay between images B and C has been determined to be about
24±3 days. A simple model for the lensing galaxy and the nearby
galaxies then leads to
h = 0.42±0.06
[113], although
higher values for h are obtained by more sophisticated analyses:
h = 0.60±0.17
[63],
h = 0.52±0.14
[73].
The results depend on how the lensing galaxy and those in
the compact group of which it is a part are modelled.
Another quadruple-lens system, B1606+656, leads to
h = 0.59±0.08±0.15, where the first error is the 95%
C.L. statistical error,
and the second is the estimated systematic uncertainty
[41].
Time delays have also recently been determined for the
Einstein ring system B0218+357, giving
h = 0.69+0.13-0.19 (95%
C.L.) [11].
Mainly because of the systematic uncertainties in modelling the mass
distribution in the lensing systems, the uncertainty in the h
determination by gravitational lens time delays remains rather large.
But it is reassuring that this completely independent method gives
results consistent with the other determinations.
3.3. Conclusions on H0
To summarize, relative distance methods favor a value
h 0.6 -
0.8. Meanwhile the fundamental physics methods typically lead to
h 0.4 - 0.7. Among
fundamental physics approaches, there has
been important recent progress in measuring h via the
Sunyev-Zel'dovich effect and time delays between different images of
gravitationally lensed quasars, although the uncertainties remain
larger than via relative distance methods. For the rest of this
review, we will adopt a value of h = 0.65±0.08. This corresponds to
t0 = 6.52h-1 Gyr = 10±2
Gyr for m = 1 -
probably too low compared to the ages of the oldest globular clusters.
But for
m = 0.2 and
= 0, or alternatively
for m = 0.4 and
= 0.6,
t0 = 13±2 Gyr, in
agreement with the globular cluster estimate of
t0. This is one of
the weakest of the several arguments for low
m, a non-zero
cosmological constant, or both.
4. HOT DARK MATTER DENSITY
The recent atmospheric neutrino data from Super-Kamiokande
[46]
provide strong evidence of neutrino oscillations and
therefore of non-zero neutrino mass. These data imply a lower limit
on the hot dark matter (i.e., light neutrino) contribution to the
cosmological density
0.001.
is
actually that low, and therefore cosmologically uninteresting, if
m( ) >>
m(µ), as is
suggested by the hierarchical
pattern of the quark and charged lepton masses. But if the
and µ are nearly
degenerate in mass, as suggested by their
strong mixing, then
could be substantially larger.
Although the Cold + Hot Dark Matter (CHDM) cosmological model with
h 0.5,
m = 1, and
= 0.2 predicts power
spectra of cosmic density and CMB anisotropies that are in excellent
agreement with the data
[96,
49],
as we have just seen the large
value measured for the Hubble parameter makes such
m = 1 models
dubious. It remains to be seen whether including a significant amount
of hot dark matter in
low-m models
improves their agreement with data. Primack & Gross
[97,
98]
found that the possible improvement of the
low-m flat
(CDM) cosmological models
with the addition of light neutrinos appears to be rather limited, and
the maximum amount of hot dark matter decreases with decreasing
m
[95].
For m
0.4,
[29]
find that
0.08;
[47]
finds more restrictive upper
limits with the constraint that the primordial power spectrum index
n 1, but this may not be
well motivated.
) >>
m(µ), as is
suggested by the hierarchical
pattern of the quark and charged lepton masses. But if the
and µ are nearly
degenerate in mass, as suggested by their
strong mixing, then
could be substantially larger.
Although the Cold + Hot Dark Matter (CHDM) cosmological model with
h 0.5,
m = 1, and
= 0.2 predicts power
spectra of cosmic density and CMB anisotropies that are in excellent
agreement with the data
[96,
49],
as we have just seen the large
value measured for the Hubble parameter makes such
m = 1 models
dubious. It remains to be seen whether including a significant amount
of hot dark matter in
low-m models
improves their agreement with data. Primack & Gross
[97,
98]
found that the possible improvement of the
low-m flat
(CDM) cosmological models
with the addition of light neutrinos appears to be rather limited, and
the maximum amount of hot dark matter decreases with decreasing
m
[95].
For m
0.4,
[29]
find that
0.08;
[47]
finds more restrictive upper
limits with the constraint that the primordial power spectrum index
n 1, but this may not be
well motivated.
5. COSMOLOGICAL CONSTANT
The strongest evidence for a positive
comes from
high-redshift SNe Ia, and independently from a combination of
observations indicating that
m ~ 0.4 together
with CMB
data indicating that the universe is nearly flat. We will discuss
these observations in the next section. Here we will start by looking
at other constraints on .
The cosmological effects of a cosmological constant are not difficult
to understand
[42,
74,
21].
In the early universe, the density of energy
and matter is far more important than the
term on the
r.h.s. of the Friedmann equation. But the average matter density
decreases as the universe expands, and at a rather low redshift
(z ~ 0.2 for
m = 0.3,
= 0.7) the
term
finally becomes dominant. Around this redshift, the
term
almost balances the attraction of the matter, and the scale factor
a (1 +
z)-1 increases very slowly, although it ultimately
starts increasing exponentially as the universe starts inflating under
the influence of the increasingly dominant
term. The
existence of a period during which expansion slows while the clock
runs explains why t0 can be greater than for
= 0, but this
also shows that there is an increased likelihood of finding galaxies
in the redshift interval when the expansion slowed, and a
correspondingly increased opportunity for lensing by these galaxies of
quasars (which mostly lie at higher redshift z
2).
The observed frequency of such optical lensed quasars is about what
would be expected in a standard
= 1,
= 0 cosmology, so
this data sets fairly stringent upper limits:
0.70 at 90% C.L.
[81,
69],
with more recent data giving
even tighter constraints: < 0.66 at 95%
confidence
if m +
= 1
[70].
This limit could
perhaps be weakened if there were (a) significant extinction by dust
in the E/S0 galaxies responsible for the lensing or (b) rapid
evolution of these galaxies, but there is much evidence that these
galaxies have little dust and have evolved only passively for
z 1
[120,
78,
112].
An alternative analysis
[58]
of some of the same optical lensing data gives a value
=
0.64-0.26+0.15. My group
[80]
(cf. [7])
showed that edge-on disk galaxies can lens quasars very effectively,
and discussed a case in which optical extinction is significant. But
the radio observations discussed by
[39],
which give a 2 limit
< 0.73, are not
affected by
extinction, so those are the ones quoted in the Table above. Recently
a reanalysis
[25]
of lensing using new models of the evolution
of elliptical galaxies gave
=
0.7+0.1-0.2, but Kochanek et al.
[71]
(see especially Fig. 4) show that the
available evidence disfavors such models.
A model-dependent constraint appeared to come from simulations of
CDM
[67]
and OpenCDM
[60]
COBE-normalized models with h = 0.7,
m = 0.3, and
either
= 0.7 or, for the open
case, = 0.
These models have too much power on small scales to be consistent with
observations, unless there is strong scale-dependent antibiasing of
galaxies with respect to dark matter. However, recent high-resolution
simulations
[68]
find that merging and destruction of
galaxies in dense environments lead to exactly the sort of
scale-dependent antibiasing needed for agreement with observations for
the CDM model. Similar
results have been found using simulations plus semi-analytic methods
[8]
(but cf.
[62]).
Another constraint on
from simulations is a claim
[6]
that the number of long arcs in clusters is in accord with
observations for an open CDM model with
m
= 0.3 but an order of
magnitude too low in a CDM
model with the same
m. This
apparently occurs because clusters with dense cores form too late in
such models. This is potentially a powerful constraint, and needs to
be checked and understood. It is now known that including cluster
galaxies does not alter these results
[83,
44].
6. MEASURING m
The present author, like many theorists, has long regarded the
Einstein-de Sitter
(m = 1,
= 0) cosmology as the most
attractive one. For one thing, of the three possible constant
values for - 0, 1, and
 - the only one
that can describe our universe is
m = 1. Also, cosmic
inflation is the only known solution for several otherwise intractable
problems, and all simple inflationary models predict that the universe
is flat, i.e. that
m + = 1. Since there is no
known physical reason for a non-zero cosmological constant, it was
often said that inflation favors
= 1. Of course, theoretical
prejudice is not a reliable guide. In recent years, many cosmologists
have favored
m ~ 0.3, both
because of the H0 - t0
constraints and because cluster and other relatively small-scale
measurements have given low values for
m. (For a summary of
arguments favoring low
0.2 and
= 0, see
[26];
[32]
is a review that notes that larger scale measurements favor higher
m.)
But the most exciting new evidence has come from
cosmological-scale measurements.
- the only one
that can describe our universe is
m = 1. Also, cosmic
inflation is the only known solution for several otherwise intractable
problems, and all simple inflationary models predict that the universe
is flat, i.e. that
m + = 1. Since there is no
known physical reason for a non-zero cosmological constant, it was
often said that inflation favors
= 1. Of course, theoretical
prejudice is not a reliable guide. In recent years, many cosmologists
have favored
m ~ 0.3, both
because of the H0 - t0
constraints and because cluster and other relatively small-scale
measurements have given low values for
m. (For a summary of
arguments favoring low
0.2 and
= 0, see
[26];
[32]
is a review that notes that larger scale measurements favor higher
m.)
But the most exciting new evidence has come from
cosmological-scale measurements.
Type Ia Supernovae. At present, the most promising techniques
for measuring
m and
on cosmological scales
use the small-angle anisotropies in the CMB radiation and
high-redshift Type Ia supernovae (SNe Ia). We will discuss the latter
first. SNe Ia are the brightest supernovae, and the spread in their
intrinsic brightness appears to be relatively small. The Supernova
Cosmology Project
[90]
demonstrated the feasibility of
finding significant numbers of such supernovae. The first seven high
redshift SNe Ia that they analyzed gave for a flat universe
m = 1 -
=
0.94+0.34-0.28, or equivalently
=
0.06+0.28-0.34 (< 0.51 at the 95% confidence
level)
[90].
But adding one z = 0.83 SN Ia for which they
had good HST data lowered the implied
m to 0.6±0.2 in the
flat case
[91].
Analysis of their larger dataset of 42
high-redshift SNe Ia gives for the flat case
m =
0.28+0.09 + 0.05-0.08 - 0.04 where the first
errors are statistical and the second are identified systematics
[92].
The High-Z Supernova
team has also searched successfully for high-redshift supernovae to
measure m
[48,
104],
and their 1998 dataset of 14 + 2
high-redshift SNe Ia including three for which they had HST data (two
at z 0.5 and one
at 0.97) imply m
= 0.32±0.1 in the flat case with their MLCS fitting method.
The main concerns about the interpretation of this data are evolution
of the SNe Ia
[34,
106]
and dimming by dust. A recent
specific supernova evolution concern is that the rest frame rise-times
of distant supernovae may be longer than nearby ones
[105].
But a direct comparison between nearby supernova and the SCP distant
sample shows that they are rather consistent with each other
[2].
Ordinary dust causes reddening, but hypothetical ``grey''
dust would cause much less reddening and could in principle provide an
alternative explanation for the fact that high-redshift supernovae are
observed to be dimmer than expected in a critical-density cosmology.
Grey interstellar dust would induce more dispersion than is observed,
so the hypothetical grey dust would have to be intergalactic. It is
hard to see why the largest dust grains, which would be greyer, should
preferentially be ejected by galaxies
[118].
Such dust, if it exists, would also absorb starlight and reradiate it at long
wavelengths, where there are other constraints that could, with
additional observations, rule out this scenario
[1].
Such grey
dust would also produce some reddening which could be detectable via
comparison of infrared vs. optical colors of supernovae; such a
measurement for one high-redshift SN Ia disfavors significant grey
dust extinction
[107],
and more observations could strengthen
this conclusion. Yet another way of addressing this question is to
collect data on supernovae with redshift z > 1, where the dust
scenario predicts considerably more dimming than the
cosmology. The one z > 1 supernova currently available, SCP's
``Albinoni'' (SN1998eq) at z = 1.2, favors the
cosmology.
More such data are needed for a statistically significant result, and
both the SCP and the High-Z group are attempting to get a few more
very high redshift supernovae.
CMB anisotropies. The location of the first acoustic (or
Doppler, or Sakharov) peak at angular wavenumber
l 200
indicated by the data available at the time of this meeting was
evidence in favor of a flat universe
tot
m +
1 (e.g.
[33]).
New data from the BOOMERANG long-duration balloon flight around Antarctica
[30]
and the MAXIMA-1 balloon flight
[54]
confirm this, with
tot =
1.11+0.13-0.12 at 95% C.L.
[59].
The preliminary BOOMERANG results
[30]
are lower around
l 500 than the
predictions in this second peak region in
CDM-type models (e.g.,
[57]),
and this could
[75] indicate
higher b than
expected from Big Bang Nucleosynthesis together
with the recent deuterium measurements (discussed below). However,
the MAXIMA-1 data for
l 500 are more
consistent with expectations of standard models and the standard BBN
b
[5]
(but cf.
[59]).
The BOOMERANG and MAXIMA-2 data are still being
analyzed, and other experiments will have relevant data as well.
Further data should be available in 2001 from the NASA Microwave
Anisotropy Probe satellite.
Large-scale Measurements. The comparison of the IRAS redshift
surveys with POTENT and related analyses typically give values for the
parameter
 I
m0.6 /
bI (where bI is the
biasing parameter for IRAS galaxies), corresponding to 0.3
m
3 (for an assumed
bI = 1.15). It is not clear
whether it will be possible to reduce the spread in these values
significantly in the near future -- probably both additional data and
a better understanding of systematic and statistical effects will be
required. A particularly simple way to deduce a lower limit on
m from the POTENT
peculiar velocity data was proposed by
[31],
based on the fact that high-velocity outflows from voids
are not expected in low-
models. Data on just one nearby void indicates that
m
I
m0.6 /
bI (where bI is the
biasing parameter for IRAS galaxies), corresponding to 0.3
m
3 (for an assumed
bI = 1.15). It is not clear
whether it will be possible to reduce the spread in these values
significantly in the near future -- probably both additional data and
a better understanding of systematic and statistical effects will be
required. A particularly simple way to deduce a lower limit on
m from the POTENT
peculiar velocity data was proposed by
[31],
based on the fact that high-velocity outflows from voids
are not expected in low-
models. Data on just one nearby void indicates that
m
 0.3 at the 97% C.L. Stronger
constraints are available if we assume that the probability
distribution function (PDF) of the primordial fluctuations was
Gaussian. Evolution from a Gaussian initial PDF to the non-Gaussian
mass distribution observed today requires considerable gravitational
nonlinearity, i.e. large
m. The PDF
deduced by POTENT from
observed velocities (i.e., the PDF of the mass, if the POTENT
reconstruction is reliable) is far from Gaussian today, with a long
positive-fluctuation tail. It agrees with a Gaussian initial PDF if
and only if
m ~ 1;
m < 1 is
rejected at the
2 level, and
m
0.3 is ruled out at
4
[87,
10].
It would be interesting to repeat this analysis with
newer data. Analyzing peculiar velocity data without POTENT again
leads to a strong lower limit
m > 0.3 (99%
C.L.), and together
with the SN Ia constraints leads to the conclusion that
m
0.5
[136].
0.3 at the 97% C.L. Stronger
constraints are available if we assume that the probability
distribution function (PDF) of the primordial fluctuations was
Gaussian. Evolution from a Gaussian initial PDF to the non-Gaussian
mass distribution observed today requires considerable gravitational
nonlinearity, i.e. large
m. The PDF
deduced by POTENT from
observed velocities (i.e., the PDF of the mass, if the POTENT
reconstruction is reliable) is far from Gaussian today, with a long
positive-fluctuation tail. It agrees with a Gaussian initial PDF if
and only if
m ~ 1;
m < 1 is
rejected at the
2 level, and
m
0.3 is ruled out at
4
[87,
10].
It would be interesting to repeat this analysis with
newer data. Analyzing peculiar velocity data without POTENT again
leads to a strong lower limit
m > 0.3 (99%
C.L.), and together
with the SN Ia constraints leads to the conclusion that
m
0.5
[136].
Measurements on Scales of a Few Mpc. A study by the Canadian
Network for Observational Cosmology (CNOC) of 16 clusters at z ~
0.3, mostly chosen from the Einstein Medium Sensitivity Survey
[55],
was designed to allow a self-contained measurement of
m from a field
M/L which in turn was deduced from their
measured cluster M/L. The result was
m = 0.19±0.06
[18].
These data were mainly compared to
standard CDM models, and they appear to exclude
m = 1 in such
models.
Estimates on Galaxy Halo Scales. Work by Zaritsky et al.
[133]
has confirmed that spiral galaxies have massive halos. They collected
data on satellites of isolated spiral galaxies, and concluded that the
fact that the relative velocities do not fall off out to a separation
of at least 200 kpc shows that massive halos are the norm. The
typical rotation velocity of
~ 200 - 250 km s-1 implies a mass
within 200 kpc of ~ 2 × 10¹²
M . A careful
analysis
taking into account selection effects and satellite orbit
uncertainties concluded that the indicated value of
m exceeds
0.13 at 90% confidence
[135],
with preferred
values exceeding 0.3. Newer data suggesting that relative velocities
do not fall off out to a separation of ~ 400 kpc
[134]
presumably would raise these
m estimates. Weak
lensing data confirms the existence of massive galactic halos
[116,
125,
4,
131].
. A careful
analysis
taking into account selection effects and satellite orbit
uncertainties concluded that the indicated value of
m exceeds
0.13 at 90% confidence
[135],
with preferred
values exceeding 0.3. Newer data suggesting that relative velocities
do not fall off out to a separation of ~ 400 kpc
[134]
presumably would raise these
m estimates. Weak
lensing data confirms the existence of massive galactic halos
[116,
125,
4,
131].
Cluster Baryons vs. Big Bang Nucleosynthesis. White et al.
[128]
emphasized that X-ray observations of the abundance of baryons
in clusters can be used to determine
m if clusters are a fair
sample of both baryons and dark matter, as they are expected to be
based on simulations
[38].
The fair sample hypothesis implies that
| (1)
|
We can use this to determine
m using the
baryon abundance
b
h2 = 0.019±0.0024 (95% C.L.) from the measurement
of the deuterium abundance in high-redshift Lyman limit systems, of which
a third has recently been analyzed
[66,
122]
and more are in
the pipeline D. Tytler, these proceedings. Using X-ray data from an
X-ray flux limited sample of clusters to estimate the baryon fraction
fb = 0.075h-3/2
[84]
gives m =
0.25h-1/2 = 0.3±0.1 using
h = 0.65±0.08. Estimating the baryon fraction
using Sunyaev-Zel'dovich measurements of a sample of 18 clusters gives
fb = 0.077h-1
[19],
and implies m =
0.25h-1 = 0.38±0.1.
Cluster Evolution. The dependence of the number of clusters on
redshift can be a useful constraint on theories
[36].
But the cluster data at various redshifts are difficult to
compare properly since they are rather inhomogeneous. Using just
X-ray temperature data,
[37]
concludes that
m
0.45±0.2, with
m = 1 strongly
disfavored.
Power Spectrum. In the context of the
CDM class of models,
two additional constraints are available. The spectrum shape
parameter  m h
0.25±0.05, implying
m
0.4±0.1. A new
measurement
m = 0.34±0.1
comes from the amplitude of the power spectrum of fluctuations at
redshift z ~ 3, measured from the Lyman
forest
[127].
This result is strongly inconsistent with
high-m models
because they would predict that the
fluctuations grow much more to z = 0, and thus would be lower at
z = 3 than they are observed to be.
m h
0.25±0.05, implying
m
0.4±0.1. A new
measurement
m = 0.34±0.1
comes from the amplitude of the power spectrum of fluctuations at
redshift z ~ 3, measured from the Lyman
forest
[127].
This result is strongly inconsistent with
high-m models
because they would predict that the
fluctuations grow much more to z = 0, and thus would be lower at
z = 3 than they are observed to be.
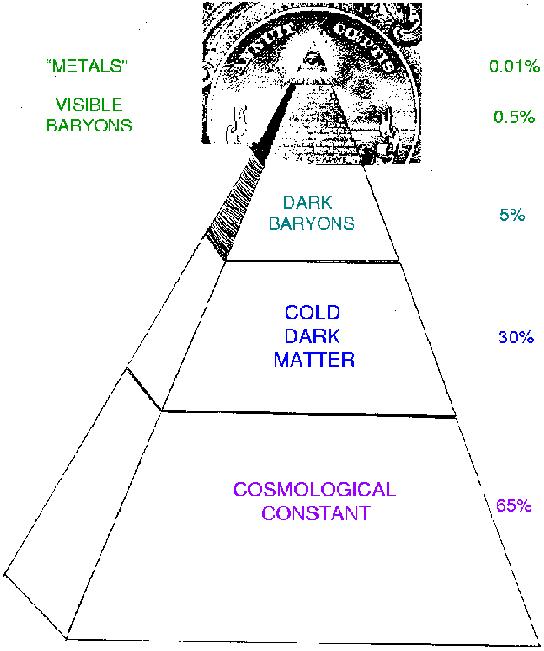
7. CONCLUSION
We thus end up with a picture of the distribution of the density of
energy density in a flat universe represented by
Figure 1
[99].
One of the most striking things about the
present era in cosmology is the remarkable agreement between the
values of the cosmological densities and the other cosmological
parameters obtained by different methods - except possibly for the
quasar lensing data which favors a higher
m and lower
, and the arc lensing
data which favors lower values
of both parameters. If the results from the new CMB measurements end
up agreeing with those from the other methods discussed above, the
cosmological parameters will have been determined to perhaps 10%, and
cosmologists can focus their attention on the other subjects that I
mentioned at the beginning: origin of the initial fluctuations, the
nature of the dark matter and dark energy, and the formation of
galaxies and large-scale structure. Cosmologists can also speculate
on the reasons why the cosmological parameters have the values that
they do, but this appears to be the sort of question whose answer may
require a deeper understanding of fundamental physics - perhaps from
a superstring theory of everything.
This work was supported in part by NSF and NASA grants
and a faculty grant at UCSC. I am grateful to Leo Stodolsky for
hospitality at the Max Planck Institute for Physics in Munich, and
to the Alexander von Humboldt Foundation for a Humboldt Award.
REFERENCES
A. Aguirre, Z. Haiman:
ApJ 532, 28 (2000)
G. Aldering, R.A. Knop, P. Nugent:
AJ 119, 2110 (2000)
W.D. Arnett, D. Branch, J.C. Wheeler:
Nature 314, 337 (1985)
D. Bacon et al.:
astroph/0003008 (2000)
A. Balbi et al.:
astroph/0005124 (2000)
M. Bartelmann, A. Huss, J.M. Colberg, A. Jenkins, F. Pearce:
A&A 330, 1 (1998)
M. Bartelmann, A. Loeb:
ApJ 503, 48 (1998)
A.J. Benson, S. Cole, C.S. Frenk, C.M. Baugh, C.G. Lacey:
astroph/9903343 (1999)
O.G. Benvenuto, L.G. Althaus:
MNRAS 303, 30 (1999)
F. Bernardeau, R. Juskiewicz, A. Dekel, F.R. Bouchet:
MNRAS 274, 20 (1995)
A.D. Biggs et al.:
MNRAS 304, 349 (1999)
M. Birkinshaw, J.P. Hughes:
ApJ 420, 33 (1994)
M. Birkinshaw, J.P. Hughes, K.A. Arnoud:
ApJ 379, 466 (1991)
M. Birkinshaw:
Phys. Rep. 310, 97 (1999)
M. Bolte, C.J. Hogan:
Nature 376, 399 (1995)
M. Bolte:
Nature 385, 205 (1997)
D. Branch:
Astroph. J. 392, 35 (1992)
R.G. Carlberg, H.K.C. Yee, E. Ellingson:
ApJ 478, 462 (1997)
J.E. Carlstrom et al.:
Physica Scripta T 85, 148 (2000)
E. Carretta, R.G. Gratton, G. Clementini, F. Fusi Pecci:
ApJ 533, 215 (2000)
S.M. Carroll, W.H. Press, E.L. Turner:
Ann. Rev. Astron. Astrophys. 30, 499 (1992)
B. Chaboyer:
ApJ 444, L9 (1995)
B. Chaboyer, P. Demarque, P.J. Kernan, L.M. Krauss:
Science 271, 957 (1996)
B. Chaboyer, P. Demarque, P.J. Kernan, L.M. Krauss:
ApJ 494, 96 (1998)
M. Chiba, Y. Yoshii:
ApJ 510, 42 (1999)
P. Coles, G.F.R. Ellis:
Is the Universe Open or Closed? (Cambridge
University Press, Cambridge 1997)
J.J. Cowan, A. McWilliam, C. Sneden, D.L. Burris:
ApJ 480, 246 (1997)
J.J. Cowan et al.:
ApJ 521, 194 (1999)
R.A.C. Croft, W. Hu, R. Davé:
Phys. Rev. Lett. 83, 1092 (1999)
P. deBernardis et al.:
Nature 404, 955 (2000)
A. Dekel, M.J. Rees:
ApJ 422, L1 (1994)
A. Dekel, D. Burstein, S.D.M. White: In:
Critical Dialogues in
Cosmology, ed. by N. Turok (World Scientific, Singapore 1997) p. 175
S. Dodelson: In: LeptonPhoton 99, Int. J. Mod. Phys. (in press,
2000), hep-ph/9912470
P.S. Drell, T.J. Loredo, I. Wasserman:
ApJ 530, 593 (2000)
R.G. Eastman, B.P. Schmidt, R. Kirshner:
ApJ 466, 911 (1996)
V.R. Eke, S. Cole, C.S. Frenk:
MNRAS 282, 263 (1996)
V.R. Eke, S. Cole, C.S. Frenk, J.P. Henry:
MNRAS 298, 1145 (1998);
cf. J.P. Henry:
ApJ 534, 565 (2000)
A.E. Evrard, C.A. Metzler, J.F. Navarro:
ApJ 469, 494 (1996)
E.E. Falco, I.I. Shapiro, L.A. Moustakas, M. Davis:
ApJ 484, 70 (1997)
E.E. Falco, C.S. Kochanek, J.M. Munoz:
ApJ 494, 47 (1998)
C.D. Fassnach et al.:
ApJ 527, 498 (1999)
J.E. Felton, R. Isaacman:
Rev. Mod. Phys. 58, 689 (1986)
L. Ferrarese et al.:
ApJ 529, 745 (2000)
R.A. Flores, A.H. Maller, J.R. Primack:
astroph/9909397 (1999)
W. Freedman et al.: ApJ submitted (2000)
Y. Fukuda et al.:
Phys. Rev. Lett. 81, 1562 (1998)
M. Fukugita, G.C. Liu, N. Sugiyama:
hepph/9908450 (1999)
P. Garnavich et al.:
ApJ, 493, L53 (1998)
E. Gawiser, J. Silk:
Science 280, 1405 (1998)
B.K. Gibson et al.:
ApJ 529, 723 (2000)
R.G. Gratton et al.:
ApJ 491, 749 (1997)
M. Hamuy et al.:
AJ 112, 2398 (1996)
H. Harris et al.:
ApJ 524, 1000 (1999)
S. Hanany et al.:
astroph/0005123 (2000)
J.P. Henry et al.:
ApJ 386, 408 (1992)
M. Hernanz et al.:
ApJ 434, 652 (1994)
W. Hu, D.N. Spergel, M. White:
Phys. Rev. D 55, 3288 (1997)
M. Im, E. Griffiths, K.U. Ratnatunga:
ApJ 475, 457 (1997)
A.H. Jaffe et al.:
astro-ph/0007333 (2000)
A. Jenkins et al.:
ApJ 499, 20 (1998)
S. Jha et al.:
ApJS 125, 73 (1999)
G. Kauffmann, J.M. Colberg, A. Diaferio, S.D.M. White:
MNRAS 303, 188 (1999)
C.R. Keeton, C.S. Kochanek:
ApJ 487, 42 (1997)
R.C. Kennicutt, W.L. Freedman, J.R. Mould:
AJ 110, 1476 (1995)
R.C. Kennicutt et al.:
ApJ 498, 181 (1998)
D. Kirkman, D. Tytler, S. Burles, D. Lubin, J.M. O'Meara:
ApJ 529, 655 (2000)
A. Klypin, J.R. Primack, J. Holtzman:
ApJ 466, 13 (1996)
A. Klypin, G. Gottloeber, A. Kravtsov, A. Khokhlov:
ApJ 516, 530 (1999)
C.S. Kochanek:
ApJ 419, 12 (1993)
C.S. Kochanek:
ApJ 466, 638 (1996)
C.S. Kochanek et al.: In:
After the Dark Ages, ed. by S.S. Holt, E.P.
Smith, AIP Conf. Proc. 470 (American Institute of Physics,
New York 1999) p. 163
T. Kundic et al.:
ApJ 482, 75 (1997)
T. Kundic, J.G. Cohen, R.G. Blandford, L.M. Lubin:
AJ 114, 507 (1997)
O. Lahav, P. Lilje, J.R. Primack, M.J. Rees:
MNRAS 251, 128 (1991)
A.E. Lange et al.:
astroph/0005004 (2000)
S.K. Leggett, M.T. Ruiz, P. Bergeron:
ApJ 497, 294 (1998)
B. Leibundgut, P.A. Pinto:
ApJ 401, 49 (1992)
S. Lilly et al.:
ApJ 455, 108 (1995)
R.A. Malaney, G.J. Mathews, D.S.P. Dearborn:
ApJ 345, 169 (1989)
A. Maller, R. Flores, J.R. Primack:
ApJ 486, 681 (1997)
D. Maoz, H.W. Rix:
ApJ 416, 425 (1993)
G.J. Mathews, D.N. Schramm:
ApJ 404, 468 (1993)
M. Meneghetti et al.:
astroph/9907324 (1999)
J.J. Mohr, B. Mathiesen, A.E. Evrard:
ApJ 517, 627 (1999)
J.R. Mould et al.:
ApJ 529, 786 (2000)
P. Nugent et al.:
Phys. Rev. Lett. 75, 394
Erratum 75, 1874 (1995)
A. Nusser, A. Dekel:
ApJ 405, 437 (1993)
T.D. Oswalt, J.A. Smith, M.A. Wood, P. Hintzen:
Nature 382, 692 (1996)
J. Pelt et al.:
A&A 286, 775 (1994)
S. Perlmutter et al.:
ApJ 483, 565 (1997)
S. Perlmutter et al.:
Nature 391, 51 (1998)
S. Perlmutter et al.:
ApJ 517, 565 (1999)
M.M. Phillips et al.:
AJ 118, 1766 (1999)
W.H. Press, G.B. Rybicki, J.N. Hewitt:
ApJ 385, 416 (1992)
J.R. Primack, J. Holtzman, A.A. Klypin, D.O. Caldwell:
Phys. Rev. Lett. 74, 2160 (1995)
J.R. Primack: In
Critical Dialogues in Cosmology, ed. by N. Turok
(World Scientific, Singapore 1997) p. 535
J.R. Primack, M.A.K. Gross: In:
The Birth of Galaxies, Xth Recontre
de Blois 1998, ed. by B. Guiderdoni et al. (Editions Frontieres,
2000, in press),
astroph/9810204
J.R. Primack, M.A.K. Gross: In: Current Aspects of Neutrino
Physics, ed. by D.O. Caldwell (Springer, Berlin 2000, in press),
astro-ph/0007165
J.R. Primack, N.E. Abrams, `Introduction to the Conference', In:
Cosmic Questions Conference, Smithsonian Museum of Natural History,
Washington, DC, April 1999 (NY Academy of Sciences, New York 2000,
in press)
S. Refsdal:
MNRAS 128, 307 (1964)
I.N. Reid:
AJ 114, 161 (1997)
H.B. Richer, G.G. Fahlman, J. Rosvick, R. Ibata:
ApJ 504, L91 (1998)
A.G. Riess, W.H. Press, R.P. Kirshner:
ApJ 473, 88 (1996)
A.G. Riess et al.:
AJ 116, 1009 (1998)
A.G. Riess, A.V. Filippenko, W. Li, B.P. Schmidt:
AJ 118, 2668 (1999)
A.G. Riess:
astroph/0005229 (2000)
A.G. Riess et al.:
ApJ 536, 62 (2000)
A. Rosenberg, I. Saviane, G. Piotto, A. Aparicio:
AJ 118, 2306 (1999)
M. Rowan-Robinson:
The Cosmological Distance Ladder (Freeman,
New York 1985)
P. Ruiz-Lapuente et al.:
ApJ 439, 60 (1995)
A. Saha, A. Sandage, G.A. Tammann, L. Labhardt, F.D. Macchetto, N.
Panagia:
ApJ 522, 802 (1999)
D. Schade et al.:
ApJ 464, L63 (1996)
P. Schechter et al.:
ApJ 475, L85 (1997)
B.P. Schmidt, R.P. Kirschner, R.G. Eastman:
ApJ 395, 366 (1992)
B.P. Schmidt et al.:
ApJ 432, 42 (1994)
SDSS Collaboration:
astroph/9912119 (1999)
M. Serra-Ricart et al.:
ApJ 526, 40 (1999)
J.T. Simonsen, S. Hannestad:
A&A 351, 1 (1999)
C. Sneden et al.:
ApJ 467, 819 (1996)
C.C. Steidel, M. Dickinson, S.E. Persson:
ApJ 437, L75 (1994)
P.B. Stetson, D.A. VandenBerg, M. Bolte:
PASP 108, 560 (1996)
D. Tytler, J.M. O'Meara, N. Suzuki, D. Lubin:
Physica Scripta T 85, 12 (2000)
S. van den Bergh:
ApJ 453, L55 (1995)
D.A. VandenBerg, M. Bolte, P.B. Stetson:
Ann. Rev. Astron. Astroph. 34, 461 (1996)
L. Van Waerbeke et al.:
astroph/0002500 (2000)
T.E. Vaughan et al.:
ApJ 439, 558 (1995)
D.H. Weinberg et al.:
ApJ 522, 563 (1999)
S.D.M. White, G. Efstathiou, C.S. Frenk:
MNRAS 262, 1023 (1993)
L. Williams, P. Schechter:
Astronomy & Geophysics 38(5), 10 (1997)
D.E. Winget et al.:
ApJ 315, L77 (1987)
D.M. Whittman, et al.:
astroph/0003014 (2000)
M.A. Wood:
ApJ 386, 539 (1992)
D. Zaritsky, R. Smith, C. Frenk, S.D.M. White:
ApJ 405, 464 (1993)
D. Zaritsky, R. Smith, C. Frenk, S.D.M. White:
ApJ 478, 39 (1997)
D. Zaritsky, S.D.M. White:
ApJ 435, 599 (1994)
I. Zehavi, A. Dekel:
Nature 401, 252 (1999)