


Models for IRAS galaxy spectra have been reviewed by Rowan-Robinson (1987a, b) and Helou (1989). The first model proposed was a simple 2-component model consisting of warm (50 K) dust in molecular clouds/HII regions and cool (20 K) dust in the interstellar medium heated by the interstellar radiation field (de Jong et al 1984). This model has been developed further by de Jong and Brink (1987) and has been criticized by Eales and Devereux (1990). The model is rather similar to that proposed by Cox and Mezger over a number of years (see Cox and Mezger 1989).
Helou (1986)
proposed an extension of this model in which the warm component
becomes a one-parameter family, with the heating intensity as the
parameter. As the
intensity increases from that found in the solar neighborhood to the
much higher
value found in star-forming regions, the dust temperature increases from
20 to 50 K. More recently,
Helou (1989)
emphasizes the similar range of IRAS colors found in
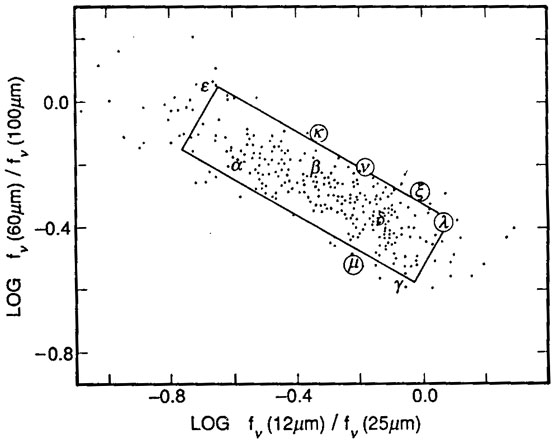
galaxies and in Galactic sources. Fig 4a shows
log{ S(60) / S(100)} versus log{ S(12)IS(25)} for IRAS galaxies and
Fig 4b shows the same diagram for Galactic
sources. The sequence of colors found in the reflection nebulosity
surrounding  Per by
Boulanger et al
(1988)
with increasing distance from the star is also shown. This
appears to be telling support for Helous hypothesis that the variation
of color is
simply due to variation of the heating intensity experienced by the
grains.
Per by
Boulanger et al
(1988)
with increasing distance from the star is also shown. This
appears to be telling support for Helous hypothesis that the variation
of color is
simply due to variation of the heating intensity experienced by the
grains.
|

|
Figure 4. IRAS color-color diagrams for (a)
galaxies, (b) Galactic star-forming regions
(Helou 1989).
In (b) the crosses denote data for |
Rowan-Robinson and Crawford
(1986,
1989)
have also used the analogy with Galactic
sources to derive a rather different model for IRAS galaxy spectra. They
propose that
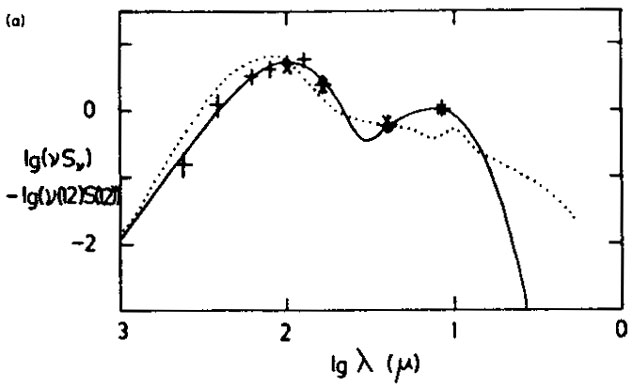
the galaxy spectra are a mixture of three components, the general disc
emission of the
galaxy consisting of reradiation of the interstellar radiation field
absorbed by
interstellar grains (Fig 5a), a component
present in Seyferts peaking at 25 µm due to
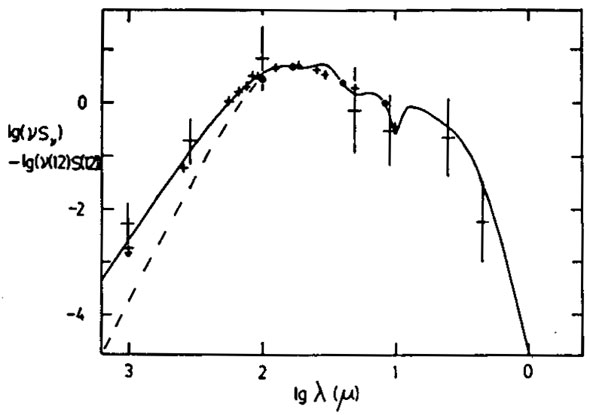
dust in the narrow-line region, and a starburst component with a
spectrum similar to
that for Galactic compact HII regions. Their models for the latter
(Crawford and
Rowan-Robinson 1986)
are optically thick at visible and ultraviolet wavelengths,
with AV  20 (they
are optically thin in the far infrared, of course).
Fig 5b compares their starburst model spectrum
with the
Telesco et al (1984)
spectrum of the
NGC1068 starburst component and with the average
spectrum for Galactic
compact HII regions/regions of massive star formation derived by
Rowan-Robinson
(1979).
Confirmation of the fact that most of the massive star formation in
galaxy starbursts
takes place at high visible-uv optical depth comes from a comparison of
the 60 µ luminosity of a large sample of IRAS galaxies with their
H
20 (they
are optically thin in the far infrared, of course).
Fig 5b compares their starburst model spectrum
with the
Telesco et al (1984)
spectrum of the
NGC1068 starburst component and with the average
spectrum for Galactic
compact HII regions/regions of massive star formation derived by
Rowan-Robinson
(1979).
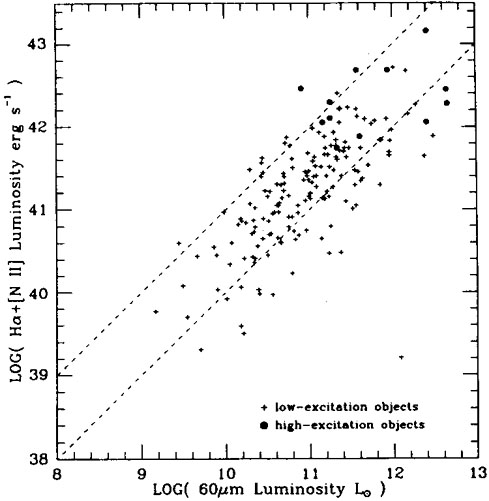
Confirmation of the fact that most of the massive star formation in
galaxy starbursts
takes place at high visible-uv optical depth comes from a comparison of
the 60 µ luminosity of a large sample of IRAS galaxies with their
H luminosity
(Leech et al 1988,
Fig 5c). Ratios of these luminosities range
from 200-4000, compared with
30-100 for the nearby normal galaxies studied by
Persson and Helou
(1987).
The H /
H
luminosity
(Leech et al 1988,
Fig 5c). Ratios of these luminosities range
from 200-4000, compared with
30-100 for the nearby normal galaxies studied by
Persson and Helou
(1987).
The H /
H ratios for these IRAS galaxies
indicate values for AV of only a few, so the bulk
of the far infrared radiation must come from stars whose visible light
is heavily extinguished, while the
H
radiation must come from near the surface of the star-forming volume
(Leech et al 1989).
Further evidence for high visual extinction
comes from the Brackett-alpha and -gamma observations of
Kawara et al (1989)
for a sample of starburst galaxies. From these they infer values for
AV in the range 7-33. These values are in agreement with
those inferred from the depth of the 10 µm
silicate feature in these galaxies.
ratios for these IRAS galaxies
indicate values for AV of only a few, so the bulk
of the far infrared radiation must come from stars whose visible light
is heavily extinguished, while the
H
radiation must come from near the surface of the star-forming volume
(Leech et al 1989).
Further evidence for high visual extinction
comes from the Brackett-alpha and -gamma observations of
Kawara et al (1989)
for a sample of starburst galaxies. From these they infer values for
AV in the range 7-33. These values are in agreement with
those inferred from the depth of the 10 µm
silicate feature in these galaxies.
|
|
Figure 5. Models by Rowan-Robinson & Crawford (1989) for (a) the cirrus and (b) the starburst components in galaxy spectra. The broken curve in Fig (b) shows the effect of changing the wavelength at which the grain absorption efficiency steepens to 80 µm. |
|
Figure 5c. H-alpha luminosity versus infrared luminosity for sample of IRAS galaxies (Leech et al 1988). The broken lines correspond to L(60µm) / L(H-alpha) = 400 and 4000. |
Once we are dealing with dust clouds with AV >> 1, then the illumination geometry becomes of critical importance for models of the infrared spectra. Evolved HII regions in our Galaxy show strong deviations from spherical geometry, often displaying a blister geometry, although it is possible that for young compact HII regions spherical symmetry is a reasonable approximation (Rowan-Robinson 1982, Crawford and Rowan-Robinson 1986). Efstathiou and Rowan-Robinson (1990) have developed an accurate radiative transfer code for axially symmetric dust clouds. Fig 6 illustrates the crucial importance of the aspect angle when viewing a non spherically-symmetric system. Leisawitz (1990) has also studied the role of non-spherical geometry in star-forming regions.

|
Figure 6. Sequence of flared disc models for the narrow-line region of NGC4151, as a function of the viewing angle, from face-on (top) to edge-on (bottom) (Efstathiou & Rowan-Robinson 1990). |
An improved model for IRAS galaxy spectra, which is essentially a fusion of the approaches of Helou and of Rowan-Robinson and Crawford, will be described in section 5.