


If we concentrate first on the 'cirrus' component in galaxies, the reradiation by interstellar dust of the energy absorbed from the interstellar radiation field, then it is clear that a satisfactory model involves a number of ingredients. Firstly a multiple (or aggregate ?) grain model is required to account for the interstellar extinction curve and it must incorporate very small grains and/or PAH. Secondly the model must allow for the fact that there is a range of heating intensities within galaxies and from galaxy to galaxy. For our Galaxy and a few other nearby galaxies we may hope to study how the observed spectrum varies with heating intensity. For more distant galaxies for which we have only the integrated spectrum we have to make do, for the moment, with a characteristic heating intensity. Let me define X = I / Iisrf, where I is the intensity in the region under consideration and Iisrf is the intensity of the interstellar radiation field in the solar neighborhood, which I assume to be as characterized by Mathis et al (1983). Finally we may have to allow for the fact that for X > some critical value, the very small grain component starts to be destroyed.
Models which satisfy the first two of these requirements were presented by Draine and Anderson (1985). Bernard and Desert (1990) have given some details of work which satisfies all three requirements. Here I give some results from an extension of my earlier interstellar grain model (Rowan-Robinson 1986), which is intended to be the simplest possible model that fits all the present observational data. The model retains the 6 grain types of the earlier work, with some modifications: (i) 0.1 µ amorphous carbon grains, their optical properties derived from circumstellar dust shells around carbon stars. The absorption efficiency of these has been reduced by a factor of 1.5 at wavelengths > 0.4 µ to improve the fit to the interstellar extinction curve at 5-9 µ, while retaining the same total extinction at wavelengths < 1 µm. This also has the effect of increasing the visible and ultraviolet albedo to a more acceptable value of 0.7. (ii) 0.1 µ amorphous silicate grains, their optical properties derived from circumstellar dust shells around M stars. (It is worth noting that 50% of the mass of carbon and 80% of the mass of silicon in interstellar grains is in the form of these larger amorphous grains. We see them being manufactured in situ. We know that this is where the bulk of interstellar grains were last made.) (iii) 0.03 µ graphite grains, (iv) 0.03 µ silicate grains, (v) 0.01 µ graphite grains, (vi) 0.01 µ silicate grains, all four types with properties as given by Draine and Lee (1984). These components are required to explain the interstellar extinction curve in the ultraviolet and the 0.22 µ feature. The main difference from the earlier model is that the mass in 0.01 µ graphite grains is now redistributed between 0.01 µ grains, 0.002 µ (20 Å) grains and 0.0005 µ (5 Å) grains. The absorption and scattering properties of these latter two species are assumed to be the same as the 0.01 µ grains at wavelengths > 0.1 µ, but because they are so small they will not be in equilibrium with the incident radiation field. Instead we have to assume that they have a certain probability p(T) dT of having a temperature between T and T + dT. The emission spectrum from these grains then has to be calculated from
IV =
 QV
BV(T) p(T) dT . QV
BV(T) p(T) dT .
| (1) |
The calculation of p(T) is a complex matter but has been carried out by Draine and Anderson (1985) for the grain properties of Draine and Lee (1984) adopted here (see also Guhathakurta and Draine 1989). Their results can be approximated analytically as
p(T) = k T-b for T1
 T
T2 , T
T2 ,
| (2) |
where b = 2.75, and k = 6.68, T1 = 2.7 K, T2 = 500 K, for the a = 20 Å grains, and k = 0.168, T1 = 2.7 K, T2 = 80 K, for the a = 5 Å grains. Here I am assuming that the very small grains emit the bulk of their radiation as a continuum. Roche (1988) estimates that galaxies emit 1% of their energy in the form of unidentified features and as only 10% of the energy of galaxies is emitted at 2-20 µ, we can infer that only about 10% of the radiation from very small grains emerges as the unidentified features. It will be relatively simple to incorporate these features into the calculation in future.
In the earlier calculation
(Rowan-Robinson
1986),
I considered values of the
wavelength at which the absorption efficiency of the 0.1 µ grains
steepened from Q
 to
Q
2 of 100, 316 and 1000
µ. In the present model I take this wavelength
to be 80 µ, which is still consistent with the IRAS data for
circumstellar dust shells
(with the possible exception of IRC+10216,
Rowan-Robinson et al
1986)
and gives an acceptable fit to the data for high latitude dust clouds in our
Galaxy. The possibility
that Q
to a wavelength significantly larger
than 100 µm is now completely ruled
out by observations in our Galaxy and other galaxies.
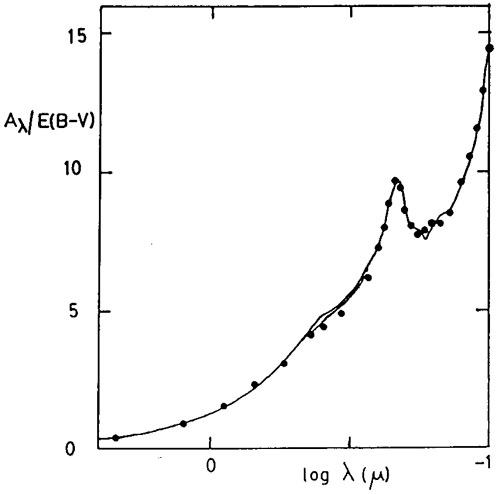
Fig 9a shows the fit to the
interstellar extinction curve at visible and ultraviolet wavelengths.
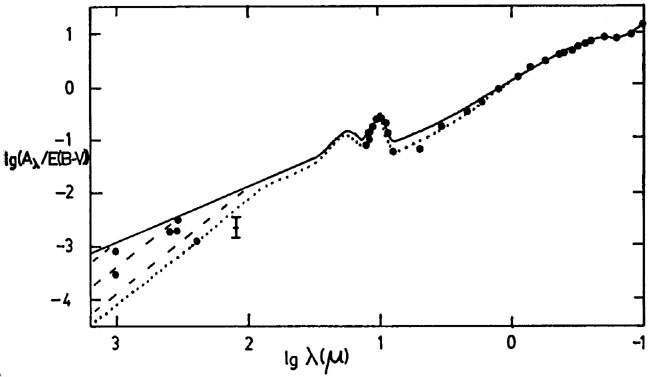
Fig 9b shows the
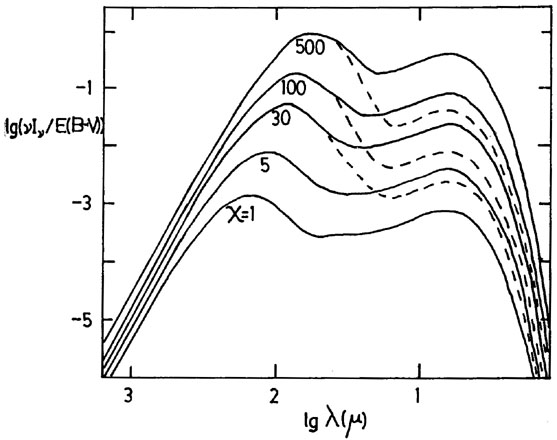
overall fit at 0.1-1000 µ. Fig 10 shows
the predicted emission spectra for
interstellar dust in the infrared for a range of heating intensities
(the temperatures of the different grain components are given in
Table 1). For X
to
Q
2 of 100, 316 and 1000
µ. In the present model I take this wavelength
to be 80 µ, which is still consistent with the IRAS data for
circumstellar dust shells
(with the possible exception of IRC+10216,
Rowan-Robinson et al
1986)
and gives an acceptable fit to the data for high latitude dust clouds in our
Galaxy. The possibility
that Q
to a wavelength significantly larger
than 100 µm is now completely ruled
out by observations in our Galaxy and other galaxies.
Fig 9a shows the fit to the
interstellar extinction curve at visible and ultraviolet wavelengths.
Fig 9b shows the
overall fit at 0.1-1000 µ. Fig 10 shows
the predicted emission spectra for
interstellar dust in the infrared for a range of heating intensities
(the temperatures of the different grain components are given in
Table 1). For X
 30, the effect of
90% depletion of the 5 Å grains is also illustrated.
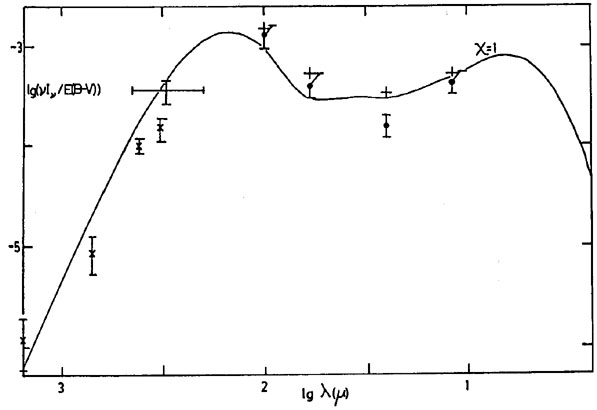
Fig 11a shows the predicted
emissivity for grains immersed in the local interstellar radiation field
compared with
observations of high latitude clouds. The agreement with observations is
excellent both
in the shape of the spectrum and in the absolute value of the
emissivity. The 12-100
µm emissivity of the isolated cloud observed by
Herter et al (1990)
also agrees with that predicted in Fig 11a.
30, the effect of
90% depletion of the 5 Å grains is also illustrated.
Fig 11a shows the predicted
emissivity for grains immersed in the local interstellar radiation field
compared with
observations of high latitude clouds. The agreement with observations is
excellent both
in the shape of the spectrum and in the absolute value of the
emissivity. The 12-100
µm emissivity of the isolated cloud observed by
Herter et al (1990)
also agrees with that predicted in Fig 11a.
|
|
Figure 9. Fit to interstellar extinction curve for model described in section 5 (a) at visible and ultraviolet wavelengths (upper curve: Rowan-Robinson 1986, lower curve: revised model (differs only near 0.4 µm) (b) in the infrared (solid and broken curves: Rowan-Robinson 1986, dotted curve: revised model). References for observations are given in Rowan-Robinson (1986). |
| type | B0 | abundance | % cosmic | grain temperatures | ||
| (× 10-4) | X = 1 | X = 10 | X = 500 | |||
| 0.1µ amor Si | 1.36 | 0.257 | 77 | 14.5 | 21.4 | 42.6 |
| 0.03µ Si | 1.10 | 0.063 | 19 | 16.8 | 24.5 | 47.0 |
| 0.01µ Si | 0.52 | 0.010 | 3 | 17.5 | 25.4 | 48.5 |
| 0.1µ amor C | 0.45 | 1.02 | 20 | 15.3 | 22.6 | 46.0 |
| 0.03µ C | 0.65 | 0.45 | 9 | 19.3 | 28.7 | 60.3 |
| 0.01µ C | 1.0 | 0.24 | 4.7 | 19.7 | 29.0 | 61.7 |
| 0.002µ C | 0.8 | 0.039 | 0.8 | |||
| 0.0005µ C | 0.8 | 0.010 | 0.2 | |||
|
Figure 10. Predicted infrared emissivity of
interstellar grains (ergs/cm2/s/mag) as a
function of the intensity of the radiation field. For X
|
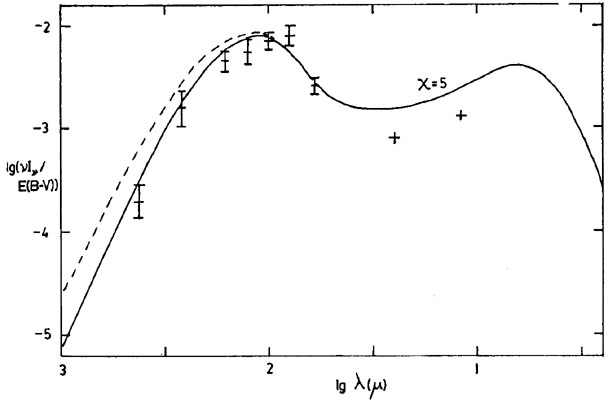
Fig 11b shows the corresponding prediction and
observations for the central regions
of the Galaxy (I < 30°), where the intensity of the radiation field
corresponds to X = 5: the fit is also satisfactory.
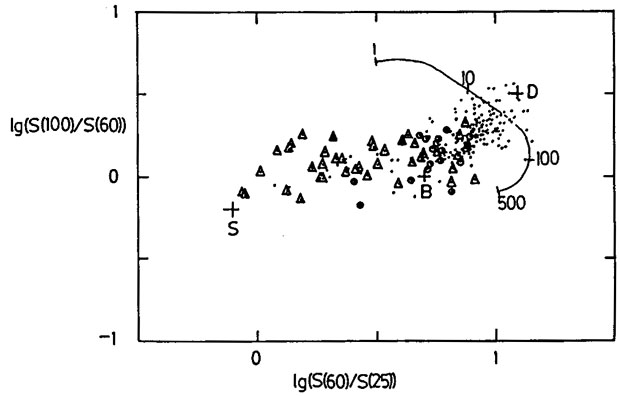
Fig 12 shows the predicted IRAS colour-colour
diagrams for X = 1-500 (color-corrected as in Appendix A of
Rowan-Robinson and
Crawford 1989)
compared with observations. Figs 12a and
b show the data for the
unresolved IRAS galaxies studied by
Rowan-Robinson and
Crawford (1989).
Figs 12c
and d show data for resolved IRAS galaxies
mapped by
Rice et al
(1988) and
Young et al (1989).
Galaxies with log{S(60) / S(25)}
0.5 need the additional Seyfert
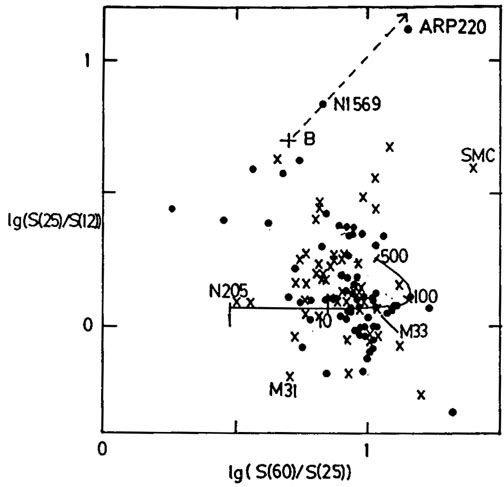
component peaking at 25 µm. For the resolved galaxies, most of
which can be
explained as pure disc (cirrus) emission, it can be seen that a range of
heating intensities are present, from X = 1 for NGC205 to X = 30 for
M33. The vast majority of the galaxies whose colors
are shown in
Figs 12 can be understood as a mixture of
Seyfert (S) + starburst (B) + one of the cirrus models (curved
lines). There are 3
classes of exception to this. (a) Two galaxies, NGC1569 and Arp 220
appear to lie on
the locus of a highly extinguished starburst model. (b) Several
galaxies, notably the
SMC, lie to the right of the cirrus curve in the
25-60-100 µm colour-colour
diagram and above and to the right of the cirrus curve in the 12-25-60
µm diagram,
consistent with the effect of destruction of very small grains at high
heating
intensities. However not all galaxies with high heating intensity show
evidence for
very small grain destruction. M33, which like the SMC has a spectrum
consistent
with X = 30, appears to have a normal abundance of very small grains. It
is also
worth noting that there appear to be no galaxies in which the abundance
of 5 Å grains
is reduced by more than a factor of 10 compared to the solar
neighborhood. The
possibility that reduction in the carbon abundance in galaxies (but not
the silicon) is
the cause of the anomalous colors needs to be explored, especially for
the SMC. (c)
Several galaxies, for example M31, have 25-60-100 µm colors
consistent with
cirrus but have very low values of S(25)/S(12), implying excess
radiation at 12 µm. Possible explanations of this are a strong
contribution from circumstellar dust shells
(Soifer et al 1986,
Rowan-Robinson and
Chester 1987:
though for M31 the
spatial distribution of the 12 µm radiation does not differ from
that at longer
wavelengths) or an unusually strong contribution from PAH/very small
grains. 8-13
µm spectroscopy of these galaxies would be very valuable.
|
|
Figure 11. Predicted emissivity, compared with observations (a) towards the Galactic pole (X = 1, data from Boulanger & Perault 1988, Halpern et al 1988, Fabbri et al 1988, assumed E(B - V) = 0.05), (b) towards the central regions of the Galaxy (X = 5, data from Beichman 1987 and refs therein, assumed E(B - V) = 6.1). The broken curve shows the effect of assuming the wavelength at which the absorption efficiency of the grains steepens is > 1mm. |

|
|
|

|
Figure 12. Predicted IRAS colour-colour diagrams for dust model of section 5. (a) and (b) Data for unresolved IRAS galaxies with good quality fluxes in all 4 bands from Rowan-Robinson and Crawford (1989). S, B denote the location of Seyfert and starburst components. The curved lines denote the cirrus models of section 5, labeled with the value of X. (c) and (d). Data for resolved IRAS galaxies with coadded fluxes in all four bands from Rice et al (1988, crosses) and Young et al (1989, filled circles). Only galaxies with fluxes brighter than 0.4 Jy in all four bands were included. The broken line in Fig 12c shows the effect of reddening (AV = 40) on the starburst component. |
Discrepant colors occasionally result from poorly determined fluxes, especially at 25 µm where not all IRAS detectors were functioning. For this reason galaxies with fluxes less than 0.4 Jy in any band were omitted from Fig 12. However in general experience suggests that IRAS colors are accurate to 0.1 in log10 and that any discrepancy greater than this has a real cause.