


Prior to the launch of IRAS rather little information on the spatial extent of far infrared emission in galaxies was available. Some of the earlier work has been reviewed by Telesco (1988). One of the most significant pre-IRAS studies was by Smith (1982), who produced a 170 µ map of the disk of M51, which showed that the bulk of the far infrared emission in M51 is produced by dust associated with the diffuse gas in the disk of the galaxy.
IRAS extended data is still under active study by several groups. Detailed maps have been produced of M31 (Habing et al 1986, Soifer et al 1987 and Walterbos and Schwering 1987), M33 (Rice et al 1990) and of the Magellanic Clouds (Schwering 1988). Rice et al (1988) have published coadded IRAS maps for all galaxies with optical extent greater than 8'. Higher resolution images may be expected for many of these galaxies from the use of maximum entropy and other deconvolution techniques now under active study at IPAC and elsewhere (e.g. Canterna et al 1990).
Subsequent studies have for the most part concentrated on wavelengths
longer than 100 µ.
Stark et al (1989)
have mapped 4 Virgo spirals at 160 and 350 µ and shown
that that there is no evidence for a grain component whose emission
peaks beyond 200 µ, a prediction of grain models with emissivity
Q
 at wavelengths > 100 µ.
Eales and
Wynn-Williams (1989)
have measured 350 and 450 µ fluxes at locations
centered on several galaxies with a 100 beam. 160 µm maps have been
published of NGC4449
(Thronson et al
1987),
NGC4214
(Tnronson et al
1988),
NGC 4485 and 4490
()
and NGC1569 and 3593
(Hunter et al 1989).
have published maps of IC10 at 95 and 160 µ and given
fluxes for several other galaxies.
Eckart et al (1990)
have mapped Centaurus A at 50
and 100 µ, and have separated the cirrus and starburst components.
have mapped M82 at 450 µm,
have mapped M83 at 100 µm and
Engargiola and Harper
(1990)
have mapped NGC6946 at 100, 160 and 250 µ.
Hughes et al (1989)
have mapped 8 IRAS galaxies at 800 µm with JCMT and
given some 450 and 1100 µm data for some of them. The importance of
the longer wavelengths is that the most reliable estimates of dust mass
can be obtained at these
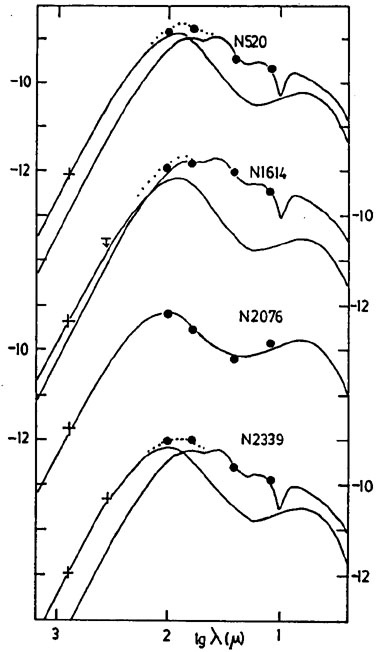
wavelengths. Fig 13 shows far infrared spectra
of selected galaxies from this latter
study, with theoretical fits derived from the models described in
section 5.
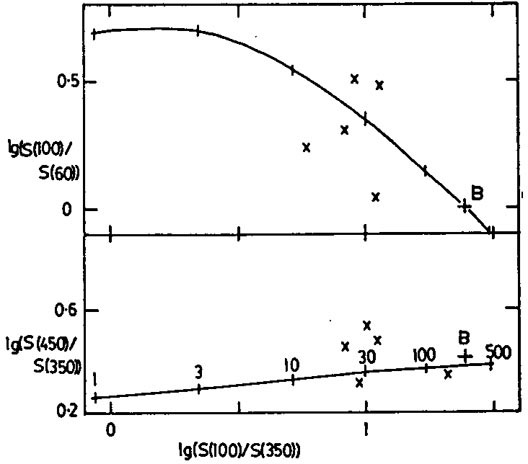
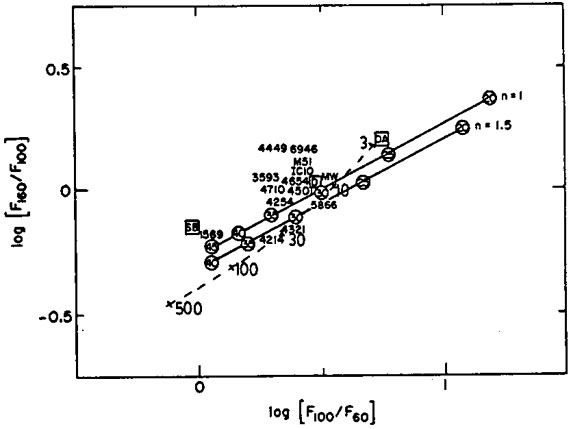
Fig 14a-d show colour-colour
diagrams derived from the work of
Thronson et al
(1990),
Hughes et al (1989)
and Eales and
Wynn-Williams (1989)
compared with the predictions of the models of
section 5.
at wavelengths > 100 µ.
Eales and
Wynn-Williams (1989)
have measured 350 and 450 µ fluxes at locations
centered on several galaxies with a 100 beam. 160 µm maps have been
published of NGC4449
(Thronson et al
1987),
NGC4214
(Tnronson et al
1988),
NGC 4485 and 4490
()
and NGC1569 and 3593
(Hunter et al 1989).
have published maps of IC10 at 95 and 160 µ and given
fluxes for several other galaxies.
Eckart et al (1990)
have mapped Centaurus A at 50
and 100 µ, and have separated the cirrus and starburst components.
have mapped M82 at 450 µm,
have mapped M83 at 100 µm and
Engargiola and Harper
(1990)
have mapped NGC6946 at 100, 160 and 250 µ.
Hughes et al (1989)
have mapped 8 IRAS galaxies at 800 µm with JCMT and
given some 450 and 1100 µm data for some of them. The importance of
the longer wavelengths is that the most reliable estimates of dust mass
can be obtained at these
wavelengths. Fig 13 shows far infrared spectra
of selected galaxies from this latter
study, with theoretical fits derived from the models described in
section 5.
Fig 14a-d show colour-colour
diagrams derived from the work of
Thronson et al
(1990),
Hughes et al (1989)
and Eales and
Wynn-Williams (1989)
compared with the predictions of the models of
section 5.
|

|
Figure 13. Far infrared and submillimeter spectra of galaxies mapped by at 800 µm, compared with models of section 5. For NGC 2076 a pure cirrus model, with depletion of the smallest grains, is satisfactory. For the other galaxies both cirrus and starburst components are required (the dotted curve indicates the total predicted flux). Parameters for the models are given in Table 2. |

|
|
|
Figure 14. Far infrared colour-colur
diagrams, compared with predictions of
interstellar grain model of section 5. (a)
100/60 versus 100/800 (data from
Hughes et al 1989),
(b) 100/60 and (c) 450/350 versus 100/350 (data from
Eales et al 1990).
(d) 160/100 versus 100/60 (data from
Thronson et al
1990:
solid curves, |