


While it is interesting to speculate that faint galaxies, like M stars, may be the major contributor to the total galaxian mass, the possibility is (at best) only weakly suggested by the evidence. However, the evidence is well known to have biases against faint galaxies. Large corrections are necessary to account for these selection effects, and there are large uncertainties in these corrections.
Like dim stars, dwarf galaxies are detectable only to relatively small distances in a flux-limited survey. This can be corrected by adjusting the results according to the volume of space effectively surveyed. Galaxy detections are also limited by the galaxy's surface brightness relative to the "background" noise, which is less easily corrected. Finally, galaxies must also be identified by their morphology, which is primarily a minimum-size requirement, but this may also include subtler effects that are difficult to quantify.
To correct for the effects of these selection criteria, we use simple models of the data and our detection methods. The methods for making these corrections are similar whether we are examining optical or 21 cm data, but the kind of galaxies most affected are often quite different as we shall explore below.
Flux limits have a surprising effect when they interact with the
galaxy luminosity function. The combination of a flux limit with the
turnover in the luminosity function results in a preferred distance at
which galaxies are detected. This can be shown by integrating the
Schechter luminosity function over the range of luminosities
detectable at distance d and multiplying by the volume
d2  d
d / 3 at that distance:
| (4) |
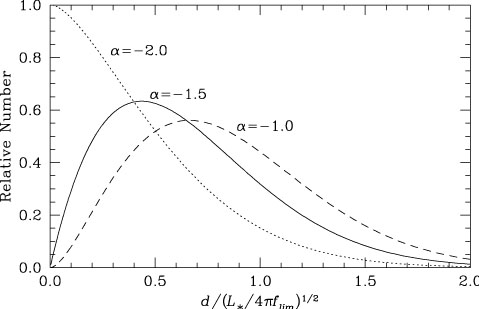
where flim is the limiting flux. The result of this
integration is shown in Figure 5.
The greatest number of galaxies is detected at about half the distance
at which an L* galaxy drops to the flux
limit. This behavior
results from the competition between the increasing volume of space,
which dominates when d << sqrt[L*
/ 4  flim],
while at large
distances the exponential cutoff at high luminosities causes a rapid
decrease in galaxy counts.
flim],
while at large
distances the exponential cutoff at high luminosities causes a rapid
decrease in galaxy counts.
|
Figure 5. The distance distribution of a flux-limited sample of galaxies obeying a Schechter function with various power law indices. The distances are scaled to the distance at which an L* galaxy reaches the flux limit, and the distributions are scaled to give the same total number of galaxies detected out to the flux limit flim. |
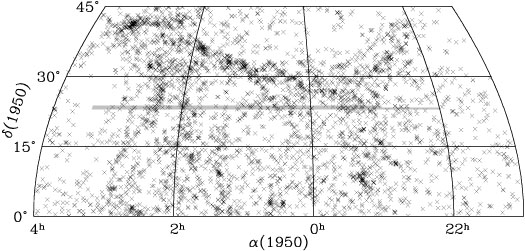
Thanks to this effect, various galaxy surveys pick out large scale structures at different distances. Since L* corresponds to an absolute magnitude of about -20, Dreyer's (1888) New General Catalogue (NGC), with a limiting magnitude of about 14, picks out galaxies at about half as far as the distance modulus of 34, or about 30 Mpc. Therefore structures like the Virgo Cluster and "Local Supercluster" stand out. Zwicky's (1962-8) Catalogue of Galaxies and Clusters of Galaxies (CGCG) pushes down to a limiting magnitude of about 15.5, so that structures about two times more distant, like the Pisces-Perseus supercluster, become prominent as shown in Figure 6 (also see Giovanelli & Haynes 1988).
|
Figure 6. Sky map of galaxy positions in the general direction of the Pisces-Perseus supercluster. Because the limiting magnitude is about 15.5, structures at a redshift of about 5000 km s-1 are most evident. The gray region was surveyed at 21 cm as is discussed later in this chapter. |
HI observations are also affected by flux limits of course. For a given limiting sensitivity the distance out to which a mass of HI, MHI can be detected is:
| (5) |
where  SHIdv is the minimum integrated line strength that can
be measured.
SHIdv is the minimum integrated line strength that can
be measured.
We will see later that the distribution of galaxies' HI masses can be
approximated by a Schechter function, so similar flux-limit effects
apply. The "turnover mass" (the equivalent of
L*) in the HI
mass function is MHI*
 1010
M
1010
M . Therefore with a
sensitivity limit of 1 Jy km s-1, a sample of randomly-selected
galaxies would most commonly be detected at distances less than 100 Mpc
(or about 7500 km s-1). This was a fairly typical detection limit
at the former Green Bank 300 ft telescope. In surveys made with
low-temperature receiver systems at Arecibo the typical flux limit was
about four times lower, corresponding to distances about two times
larger.
. Therefore with a
sensitivity limit of 1 Jy km s-1, a sample of randomly-selected
galaxies would most commonly be detected at distances less than 100 Mpc
(or about 7500 km s-1). This was a fairly typical detection limit
at the former Green Bank 300 ft telescope. In surveys made with
low-temperature receiver systems at Arecibo the typical flux limit was
about four times lower, corresponding to distances about two times
larger.
This flux-limit effect is easy to overlook because HI observations are usually made of objects selected on the basis of their optical emission. With information about the galaxy's visual appearance the 21 cm integration time is often tailored to expectations about the amount of HI. In addition, emission at the two wavelengths may be inherently correlated - larger galaxies generally have more stars and more HI - so that a sample with a visual flux limit will also have a related HI flux limit. Thus HI observations based on an optically-selected sample will tend to be biased toward the smaller of the distances favored by either of the flux limits.
It is important to recognize that using a visually flux-limited sample of galaxies has a second more insidious effect. The resulting observations may appear to indicate that the visual and HI emission are more correlated than they actually are because the high HI/low visual luminosity objects will tend to be excluded. While high visual/low HI galaxies (S0's, ellipticals) are well known, the converse may have been overlooked.
4.2. Surface Brightness Limits
Surface brightness limits also apply in both the optical and radio domains. Basically, the emission per unit area from galaxies is comparable to competing sources making it difficult to distinguish real sources from background variations. At visual wavelengths the receiver technology has improved to the point where the night sky brightness and even the surface brightness of emission from our own Galaxy make detection difficult. At 21 cm internal receiver noise is still the primary limiting factor. These effects are not easily quantified, but there is a growing recognition in the optical domain that there is a potentially large problem.
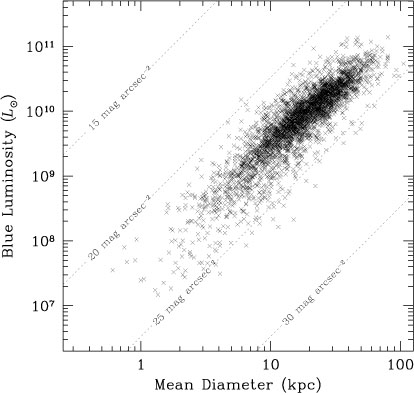
The blue luminosities and diameters of galaxies in the Third
Reference Catalog (RC3;
de Vaucouleurs
et al. 1991)
are plotted in Figure 7.
Over a very wide range of luminosities the galaxies lie within a
narrow locus of mean surface brightness around 24 mag arcsec-2 or
about 10 L
pc-2. Galaxies with surface brightnesses much
higher (to the upper left) and much lower (to the lower right) are
notably absent. This is quite surprising given the wide range of
surface brightnesses observed inside of galaxies. After all, some
outer disks of spiral galaxies have HI detected in regions where no
optical emission is visible. Why then shouldn't there be dwarf
galaxies with comparably low surface brightnesses?
|
Figure 7. The diameters and luminosities of galaxies in the Third Reference Catalog. The diameters are the geometric mean of the major and minor axes measured at the 25 mag arcsec-2 isophote in blue or "photographic" wavebands. The luminosities are based on the total blue magnitudes. Both are based on distances determined from Galactocentric velocities and a value of the Hubble constant of H0 = 75 km s-1 Mpc-1. |
The lack of fainter galaxies is partly an artifact of the way galaxy sizes are measured. Since diameters and fluxes are normally measured out to the 25 mag arcsec-2 isophote, the average surface brightness of a centrally brightened source has to be higher. Disney & Phillipps (1983) have shown further coincidences between observed galaxy surface brightness properties and the limiting surface brightnesses observed from Earth. Fainter surface brightnesses are now well within reach of modern detectors, but few systematic surveys have been completed and there are conflicting interpretations of the results (see McGaugh 1996).
For HI observations, there is little competition with background
emission. Using single-dish radio telescopes, detection of surface
densities of hydrogen down to ~ 1019 cm-2
(~ 0.1M
pc-2) requires only relatively short
integration times for most modern receiver systems. This is sufficient
to detect most spiral galaxies well outside their optical
disks. However, the "beam size" at 21 cm is often larger than the
extent of the HI being observed so that "beam dilution" can limit
the actual detectable surface brightness. With synthesis arrays the
surface brightness sensitivity depends on other factors. Essentially
the noise is equivalent to a single-dish telescope of the same total
area, but the angular area is that of the "synthesized beam."
Therefore, to reach the same surface brightness limit, longer
integration times are necessary in proportion to the ratio of the area
of the "primary beam" (of an individual array element) to the area
of the synthesized beam.
At 21 cm there is an additional dimension to the surface brightness
limits: the problem of detecting an HI signal in a one-dimensional
spectrum. The HI signal profile has a width that depends on the mass of
the object, the amount of circular rotation, and the inclination of the
rotation to the line of sight. Wider profiles are more difficult to
detect because they spread the signal over a wider frequency range, so
the noise grows in proportion to
sqrt[ v]. In an interesting
twist, face-on galaxies have low optical surface brightness (the light
is spread out over a larger solid angle), but they have higher
"spectral" surface brightness since the signal is focused into a
narrower Doppler-shift range.
In single-dish observations, the spectral surface brightness is usually the main consideration since beam dilution is essentially a flux-limit problem. In synthesis-array observations and large single-dish mapping programs, the data are often thought of as a cube with two spatial and one frequency axis. Spatial planes, or hybrid frequency/spatial planes are examined to uncover any sources of emission. In these data cubes, the practical unit of noise against which sources must be detected is the rms deviation in each beam and in each frequency channel. Detections are most enhanced when the beam size and channel width are closely matched to the source size since that maximizes the signal while minimizing the addition of noise from regions where no signal is present. However, as we will discuss later, it is usually necessary to sacrifice some surface-brightness sensitivity in order to identify the HI signal.
The procedure by which galaxies are identified proves to be an extremely difficult selection effect to quantify. A concept of what a galaxy should look like has evolved in this century based on our growing experience with these objects. In its most general morphological sense, a galaxy might be defined as an extended source with a generally elliptical or circular profile. They are centrally brightened and fade fairly steadily to undetectably low surface brightnesses in their outermost regions.
Obviously a physical definition of galaxies would be preferable,
perhaps something very general like "a distinct self-gravitating system
with a mass > 107
M."
The morphological definition
implicitly assumes stars must be present, reaching a high surface
density at the galaxy's center, but we have to be careful not to let our
description of galaxies become a self-fulfilling prophecy. At the same
time we want to avoid cluttering catalogs of galaxies with nearby
Galactic nebulae.
There is no especially strong evidence that the major catalogs are badly incomplete, but there are troubling questions. Could the narrow range of observed surface brightnesses in Figure 7 be due in part to a predisposition toward galaxies with a particular appearance? Would a system that was not significantly brighter toward its center be dismissed as a Galactic HII region? Observations at new wavebands usually show much more overlap than difference with current optical catalogs, but since these observations are almost exclusively based on starlight or its surrogates, are they providing a good measure of completeness?
I fear that the problem will only get worse with modern cataloging systems. Computer identification schemes, including "neural nets" and "decision trees," are all rigorously based on preconceived notions of the morphology of galaxies, and they are often "exercised" or "trained" on sets of objects which agree with our current expectations for a galaxy. The huge numbers of objects that will soon spill forth from various digital surveys has the potential to illuminate, but it also has the potential to overwhelm.
To broaden the scope of our understanding of galaxies, what we need are more "blind" surveys, by which I mean surveys that are not based on the visual appearance of a galaxy or on emission at another wavelength that is highly correlated with the visual. One way is by identifying band-to-band differences that might signal a galaxy. For example, it is possible to use the IRAS survey's 60 to 100 µm emission to identify what are probably cool dust-bearing objects. In this way a source may be identified independent of its morphology, although perhaps not entirely independent of prior expectations about the construction of galaxies.
Another even more unbiased way to cast our nets is with spectral surveys. These can identify any object whose redshift places it outside of the Galaxy provided the emission line is excited, sufficiently strong, and the line is observable. Any of several spectral lines might be used, but HI is the most independent of optical emission for the reasons discussed earlier. HI has its own identification problems, of course, and these are discussed in the next section.