


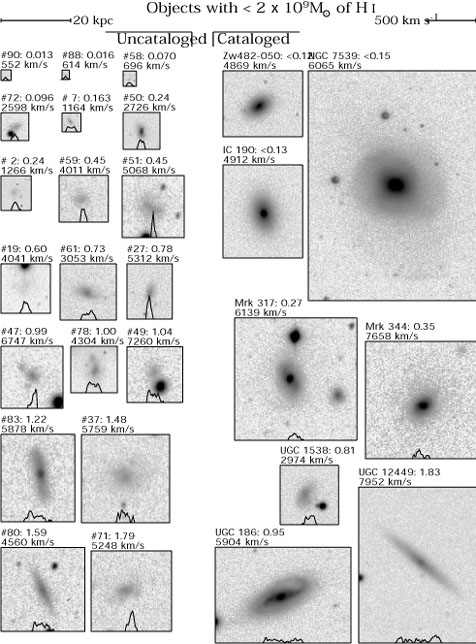
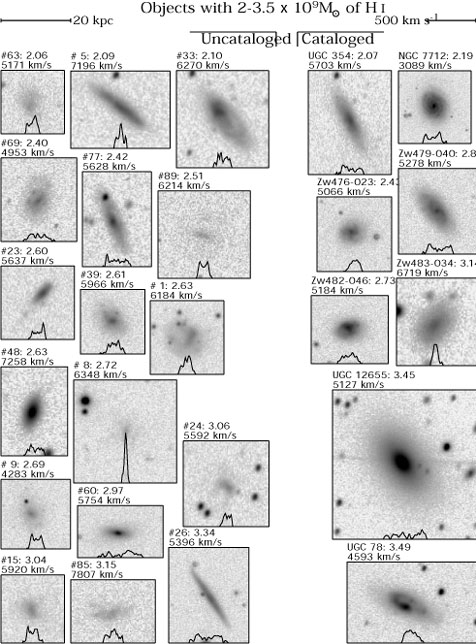
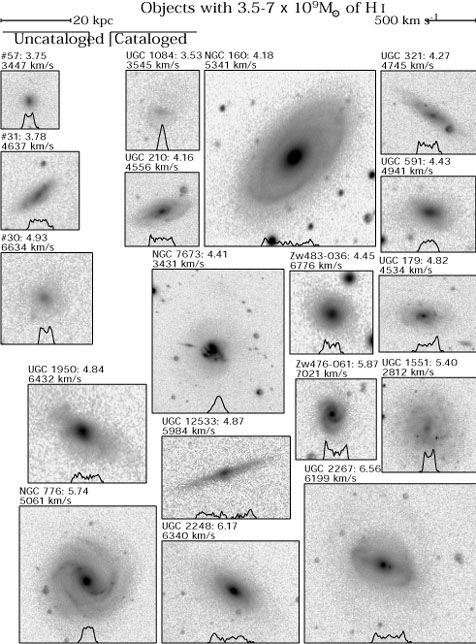
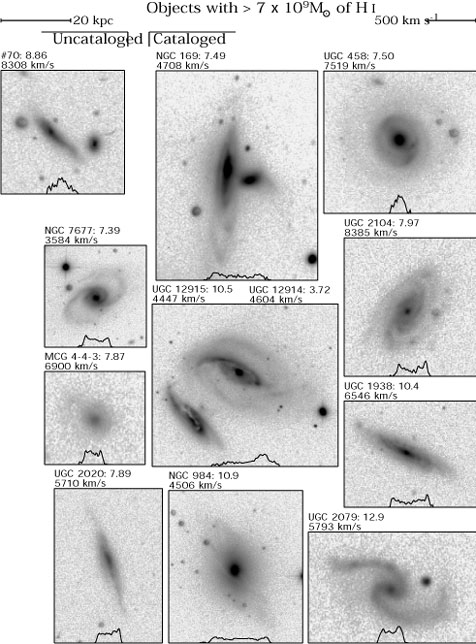
The optical characteristics of the objects found in the Arecibo slice provide further clues about what makes a galaxy stand out in an optical survey. To explore these objects' characteristics, optical images obtained at the Kitt Peak 0.9 m telescope are shown in Figure 16. The 82 galaxies comprise 40 (of 41) uncataloged objects, 35 (of 38) cataloged objects, and 7 (of 10) optically identified galaxies within the slice volume for which R-band images were obtained. (This last category includes all but UGC 1538 among the cataloged objects in the first panel of Figure 16.) They are shown in order of increasing HI mass, with previously uncataloged objects running down the left of each panel and cataloged objects on the right.
Each image is displayed using the same logarithmic gray scale so that faint outer regions can be seen at the same time as the bright cores of some galaxies. The images are all scaled to the same linear size based on their Galactocentric velocities and assuming a Hubble constant of 75 km s-1 Mpc-1.
Along the bottom of each image, the HI spectrum is shown with the same velocity scale in each case. The area under each of these HI profiles (i.e., the integrated flux) is again scaled logarithmically to the total HI mass of each object; this is to facilitate comparison without letting the range of sizes become unwieldy. Most of the HI profiles can be classified as single- or double-horned, although some are peculiar. The spectra are based on follow-up observations of the galaxies, in almost all cases after determining the centroid of the HI emission. As a result, most asymmetries in the profiles should not be caused by the placement of the object in the edge of the 21 cm beam. However, noise in the spectra (particularly for the wide profile, distant objects) is sometimes large enough that it might generate artificial asymmetries.
|
|
|
|
Figure 16.
The Arecibo slice gallery. The images are all
shown with the same logarithmic stretch on the same linear scale.
The name or HI-catalog number is followed by the HI mass in units of
109
M |
The morphologies of the uncataloged vs. cataloged galaxies exhibit a variety of differences. Some of the uncataloged objects are so similar to their cataloged counterparts, that we might conclude they were accidentally overlooked, or that they fall in the category of being just slightly beyond the optical survey cutoff criteria. In general, though, the uncataloged objects have lower surface brightnesses, and are smaller on average than their optically-cataloged counterparts, so their omission from optical catalogs is not surprising. Some of the HI-selected objects are extremely low in surface brightness, with the lowest mass one (#90) having no identified counterpart.
The uncataloged objects show a weak trend of increasing size and brightness with their HI mass. In contrast, there does not appear to be any clear correlation of optical size or surface brightness with the HI mass of the cataloged objects; there are large and small galaxies at both extremes of HI mass. The HI linewidths, which are indicative of the total mass, do appear to correlate with both the increasing HI mass and optical size and brightness.
Morphologically, the HI-selected objects have a greater incidence of asymmetric light distributions and peculiar HI profile shapes. Almost all of the cataloged objects show a nearly stellar, very high surface brightness core, and a roughly elliptical outer boundary. The exceptions appear to be interacting galaxies, or low surface brightness galaxies uniquely identified by Nilson (1973) in the Uppsala General Catalog (UGC), whose aim was to make a size-limited catalog instead of a flux-limited catalog. The uncataloged objects only rarely have a bright central region, and sometimes the bright region is offset from the center.
For the most part, the optical-identification procedures do appear to have successfully identified the galaxies they were targeting. The additional galaxies identified in the HI survey almost all fall below the flux cutoff of the optical catalogs (mB > 16) or have sizes smaller than the UGC's size limit (a < 1'). However, while the optical samples succeeded in identifying all of the most massive galaxies within the slice, they have overlooked a population of low surface brightness objects that in many cases appear to have equally large dynamical masses (based on their HI linewidths and estimated inclinations) as the galaxies of intermediate and low mass. We might expect then that the HI-selected sample will show a steeper luminosity (or mass) function than was found optically. We examine this next.
 .
The Galactocentric redshift is listed, and the
HI profile is shown along the bottom of each image.
.
The Galactocentric redshift is listed, and the
HI profile is shown along the bottom of each image.