Table of Contents
 INTRODUCTION
- THE EGRB FROM 0.03 TO 10 GEV
- The Unresolved Blazar Model:
- Critique of the Assumption of Independence of
Blazar Gamma-Ray and Radio Luminosities
- GLAST and the EGRB:
- THE EGRB BETWEEN 0.5 AND 30 MEV
- THE EGRB ABOVE 10 GEV
- CONCLUSIONS
- REFERENCES
1. INTRODUCTION
The EGRB measured by EGRET can be represented as of the power-law
form

| (1)
|
between 0.1 and ~ 50 GeV (statistics limited)
[1].
At energies below 30 MeV, the EGRB spectrum appears to be steeper, as
determined from an analysis of COMPTEL data
[2].
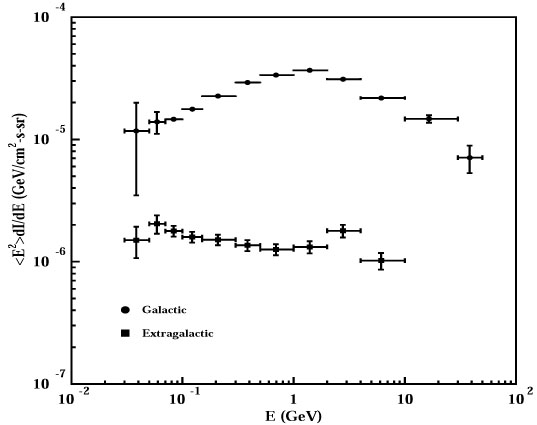
Figure 1, taken from Ref.
[3],
shows a comparison between the
diffuse inner-galactic and extragalactic spectra measured by EGRET.
It shows that these diffuse spectra have fundamentally different origins.
The galactic spectrum shows evidence of the predicted "bump" from neutral
pion decay
[4],
[5]
whereas the extragalactic spectrum shows no such feature
as would be expected from cosmic ray p - p interactions. This type of
direct spectral information eliminates purely diffuse extragalactic
cosmic-ray interaction origin models, such as have been proposed
[6]
as explanations for the EGRB.

|
Figure 1. Comparison of Galactic and
extragalactic diffuse spectra as determined by EGRET.
|
2. THE EGRB FROM 0.03 TO 10 GEV
The most promising model proposed for the origin of the GeV range
extragalactic  -ray
background (EGRB), first detected by SAS-2
and later confirmed by EGRET
[1],
is that it is the collective emission of an isotropic distribution of faint,
unresolved blazars (See Ref.
[7]
and references therein.).
Such unresolved blazars are a natural candidate for explaining the EGRB
since, they are the only significant non-burst sources of high energy
extragalactic -rays
detected by EGRET.
-ray
background (EGRB), first detected by SAS-2
and later confirmed by EGRET
[1],
is that it is the collective emission of an isotropic distribution of faint,
unresolved blazars (See Ref.
[7]
and references therein.).
Such unresolved blazars are a natural candidate for explaining the EGRB
since, they are the only significant non-burst sources of high energy
extragalactic -rays
detected by EGRET.
2.1. The Unresolved Blazar Model:
To determine the collective output of all
-ray blazars, one can use the
observed EGRET distribution of
-ray luminosities and
extrapolate to obtain a "direct"
-ray luminosity function
(LF) per comoving volume,
f(l, z)
[8].
Alternatively, one can make use of much larger catalogs at other wavelengths
and assume a relationship between the source luminosities at the catalog
wavelength and the GeV region
[9],
[10].
Both methods have uncertainties.
With regard to the former method, only the "tip of the iceberg" of the
-ray LF has been observed
by EGRET. Lower luminosity
-ray sources
whose fluxes at Earth would fall below EGRET's minimum detectable
flux, i.e. EGRET's point source sensitivity (PSS), are not
detected.
Extrapolating the -ray LF
to fainter source luminosities must then involve
some extra assumption or assumptions.
We have chosen to use the latter method and have assumed a
linear relation between the luminosities of a source at radio
and -ray wavelengths in an
attempt to estimate a LF which would hold
at fainter luminosities. The extent of such a correlation
is by no means well established
[10] -
[12].
However, since most theoretical models invoke the same high energy
electrons as the source of both the radio and
-ray emission,
a quasi-linear relation between radio and
-ray luminosities is a logical
assumption. In fact, recent observations support this supposition
[13].
We used this latter method to estimate the contribution of unresolved
blazars to the EGRB, and found that up to 100% of the EGRB measured by
can be accounted for
[7]. Our
model assumes a linear relationship between the differential
-ray luminosity
l at
Ef = 0.1 GeV and the differential radio
luminosity lr at 2.7 GHz for all sources,
l

 lr
with determined by the
observational data.
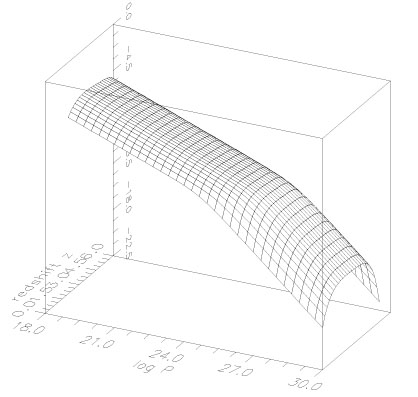
One can then used the measured radio LF
fr(lr, z) for blazars
(flat spectrum radio sources)
[14]
to calculate the collective
-ray output of all
blazars. This LF is shown in Figure 2.
lr
with determined by the
observational data.
One can then used the measured radio LF
fr(lr, z) for blazars
(flat spectrum radio sources)
[14]
to calculate the collective
-ray output of all
blazars. This LF is shown in Figure 2.

|
Figure 2. Radio luminosity (power) function
at 2.7 GHz after Dunlop and Peacock
[14].
|
The simplified elements of our calculations are as follows:
We assume that blazars spend 97% of their time in a quiescent state
and the remaining 3% of their time in a flaring state
We assume that the -ray and
radio LFs in their quiescent state are related by
f(l, z) =
-1
fr(-l
, z).
This relation changes by an average
-ray "amplification factor",
< A > = 5, when the blazars are flaring.
We assume that -ray spectra
for all sources are of the power-law form l(E) =
l(E /
Ef)- , where
is assumed to be
independent of redshift. We have taken the distribution of such spectral
indeces, , from
appropriately related EGRET data.
We also assume a slight hardening of the
blazar spectra when they are in the flaring state which is supported by
the EGRET data. For further details, see Ref.
[7].
, where
is assumed to be
independent of redshift. We have taken the distribution of such spectral
indeces, , from
appropriately related EGRET data.
We also assume a slight hardening of the
blazar spectra when they are in the flaring state which is supported by
the EGRET data. For further details, see Ref.
[7].
The number of sources N detected is a function of the
detector's PSS at the fiducial energy Ef,
[F(Ef)]min,
where the integral -ray
photon flux F is related to
l by

| (2)
|
where R0 r(1 + z) is the luminosity
distance to the source. The number of sources at
redshift z seen at Earth with an integral flux
F(Ef) is given by
| (3)
|
where l
in the integrand depends on z(r) and
F(Ef) from eq. 2. The LF,
f, includes
both quiescent and flaring terms.
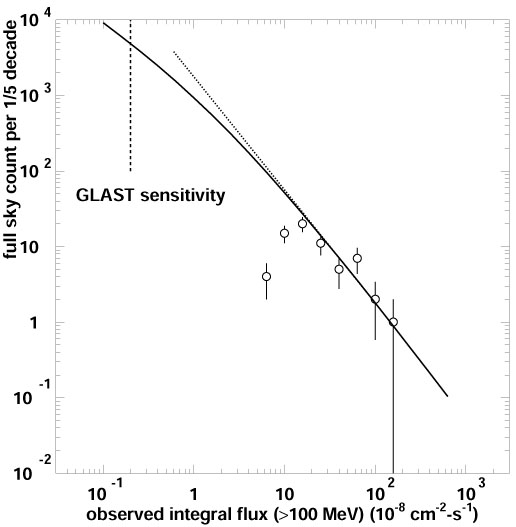
Figure 3 shows the results of our calculation
of the number of sources versus flux above 0.1 GeV, i.e., our
predicted source count curve, compared to the EGRET detections
[7]. The
cutoff at ~ 10-7 cm-2 s-1 for
Ef = 0.1 GeV, their quoted PSS,
is evident by the dropoff in the detected source count below this flux
level.

|
Figure 3. Source number count per one-fifth
decade of integral flux at Earth
The straight dotted line is the Euclidean relation
N(> F)
 F-3/2
for homogeneous distribution of sources .
The open circles represent the EGRET blazar
detections and the solid line is the model prediction. F-3/2
for homogeneous distribution of sources .
The open circles represent the EGRET blazar
detections and the solid line is the model prediction.
|
To calculate the EGRB, we integrate over all sources not
detectable by
the telescope to obtain the differential number flux of EGRB photons at an
observed energy E0:

| (4)
|
This expression includes an integration over the probability
distribution of spectral indices
based on the second
EGRET Catalog
[15].
There is also an important attenuation factor in this expression; the
attenuation occurring as the
-rays produced by blazars
propagate through intergalactic space and interact with
cosmic UV, optical, and IR background photons to produce
e± pairs.
If a substantial fraction of the EGRB is from high-z sources, a
steepening
in the spectrum should be seen at energies above ~ 20 GeV caused by the
attenuation effect
[16].
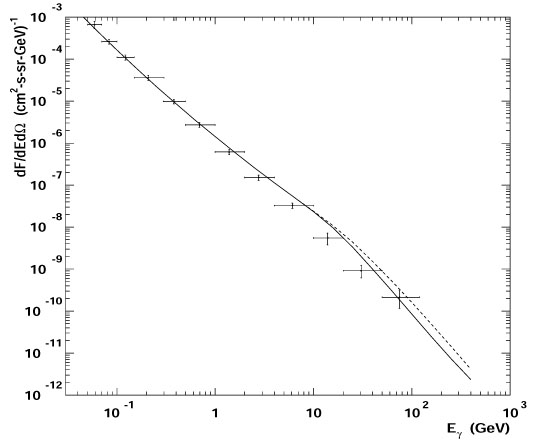
Figure 4, from Ref.
[16],
shows the calculated EGRB spectrum (based on the EGRET PSS)
compared to EGRET data. The slight curvature in the spectrum
below 10 GeV is caused by the distribution of unresolved blazar spectral
indeces; the harder
sources dominate the higher energy EGRB and the softer sources dominate the
lower energy EGRB. The steepened spectra above ~ 20 GeV in
Figure 4 show
the attenuation effect and its uncertainty.

|
Figure 4. The predicted EGRET EGRB
from unresolved blazars compared
with the EGRET data. GLAST should see an EGRB about a
factor of 2 lower at energies above 1 GeV (see text).
|
2.2. Critique of the Assumption of Independence of
Blazar Gamma-Ray and Radio Luminosities
Chiang and Mukherjee
[17]
have attempted to calculate the EGRB from
unresolved blazars assuming complete independence between blazar
-ray
and radio luminosities. They then used the intersection between the sets
of flat spectrum radio sources (FSRSs) of fluxes above 1 Jy found in the
Kühr catalogue and the blazars observed by EGRET as their
sample,
optimizing to the redshift distribution of that intersection set to obtain
a LF and source redshift evolution. Using this procedure,
they derived a LF which had a low-end cutoff at 1046 erg
s-1.
Then, with no fainter sources included in their analysis, they
concluded that only ~ 1/4 of the 0.1 to 10 GeV EGRB could be accounted
for as unresolved blazars and that another origin must be found for the EGRB
in this energy range.
We have argued above that it is reasonable to expect that the radio and
-ray
luminosities of blazars are correlated. Any such correlation will
destroy the
assumption of statisitical independence made by Chiang and Mukherjee and
introduce a bias in their analysis. In fact, their analysis leads to many
inconsistencies. Among them are the following:
A. The LF derived by Chiang and Mukherjee
[17]
allows for no sources with luminosities below
1046 erg s-1. In fact, all of the six
sources found by
EGRET at redshifts below ~ 0.2 have luminosites between
~ 1045 erg s-1 and ~ 1046 erg
s-1
[18].
Elimination of fainter sources from the analysis can only lead to a lower
limit on the EGRB from unresolved blazars. The fainter sources contribute
significantly in acounting for unresolved blazars being the dominant
component of the EGRB. (In this regard, see also, Ref.
[19])
B. Chiang and Mukherjee limit the EGRET sources in their analysis
only to the FSRSs in the Kühr catalogue. However, if there is truly no
correlation between blazar radio and
-ray luminosities, then any
of the millions
of FSRSs given by the Dunlop and Peacock radio LF
[14] are equally
likely to be EGRET sources. In that case, of the 50 odd sources
in the
2nd EGRET catalogue, virtually none, i.e. ~
10-6, should be Kühr sources.
The above discussion indicates that the assumption of non-correlation
between
the radio and -ray fluxes
of blazars made by Chiang and Mukherjee in their
analysis is not a good one and that this assumption invalidates their
conclusions.
2.3. GLAST and the EGRB:
With an estimated point
source sensitivity (PSS) nearly two orders of magnitude lower than
EGRET's, GLAST will be able
to detect O(102) times more blazars than EGRET,
and measure the EGRB spectrum to > 1 TeV (assuming the EGRET
power law spectrum).
These two capabilities will enable GLAST to either strongly
support or
reject the unresolved-blazar hypothesis for the origin of the EGRB.
Figure 3 shows that O(103)
blazars should be detectable by
GLAST, assuming it achieves a PSS of ~ 2 × 10⁻⁹
cm-2 s-1. Using this PSS and our derived source
count curve
as shown in Figure 3, we have estimated that the
remaining
"diffuse" EGRB seen by GLAST should be a factor of ~ 2 lower
for E > 1 GeV. Below 1 GeV, this factor of 2 will not apply
because source confusion owing to the poorer angular resolution of
GLAST at these lower energies will reduce the number of blazars
resolved out of the background.
We conclude that GLAST can test the unresolved blazar background
model in three ways:
A. GLAST should see roughly 2 orders of magnitude more blazars than
EGRET because of its ability to detect the fainter blazars which
contribute to the EGRB in our model. It can thus make a much deeper
determination of the source count curve. GLAST can also
determine the redshift distribution of many more identified
-ray
blazars, using its better point source angular resolution to make
identifications with optical sources having measured redshifts.
With its larger dynamic range, GLAST can then test the assumption
of an average linear relation between
the -ray and radio fluxes
of identified blazars.
All of these determinations will test the basic assumptions and results
of our model.
B. With its better PSS, GLAST will resolve out more blazars
from the background. Thus, fewer unresolved blazars will be left to
contribute to the EGRB. reducing the level of the measured EGRB
compared to EGRET's by a factor of ~ 2 if our predictions are
correct.
C. The much greater aperture of GLAST at 100 GeV will allow a
determination of whether or not a steepening exists in the EGRB, since
the number of EGRB -rays
recorded by GLAST above 100 GeV
will be of order 103 to 104, assuming a
continuation of the EGRET power-law spectrum. Such a steepening
can be caused by both absorption and intrinsic turnovers in blazar spectra.
Given enough sub-TeV spectra of individual blazars with known redshifts,
these two effects can be separated.
3. THE EGRB BETWEEN 0.5 AND 30 MEV
The explanation for the origin of the EGRB at energies in the range of
several
MeV must be a non-blazar explanation. The reason for this is that while the
EGRB spectrum in this energy range appears to be softer than that at
higher energies
[2],
the data from OSSE and COMPTEL on
individual blazars in this energy range indicate a harder
spectrum than
that at higher energies. The measured blazar spectra appear to break below
~ 10 MeV to spectra with a typical power-law index of ~ 1.7
[20].
Thus, even if unresolved blazars account for almost all of the
EGRB in the 0.1 to 10 GeV range, this cannot be the case at lower energies.
Calculations have shown that a superposition of redshifted lines from
Type Ia
and Type II supernovae should reasonably provide a significant component of
the EGRB at energies ~ 1 MeV. The important line emission is from the
decay chain 56Ni -> 56Co -> 56Fe and also
from the decay of 26Al, 44Ti and 60Co
[21],
[22].
However, supernovae cannot account for the entire EGRB in this energy range,
since they produce no line emission above 3.5 MeV.
Another serious possibility as a significant contributer to the multi-MeV
EGRB is non-thermal tails in the energy spectra of the AGN
[23].
These would be the same AGN which have recently been resolved out by the
Chandra telescope and found to be the dominant component of the once
unresolved X-ray background
[24].
A recent discussion of AGN models fitting the X-ray background has been
given in Ref. [25].
While there are no data on individual AGN in the
multi-MeV energy range at the present time, Stecker, Salamon and Done
[23]
have pointed to the galactic black hole candidate
Cyg. X-1 as an example of a black hole source which has been
shown from COMPTEL data to have a non-thermal tail extending to
multi-MeV energies
[26].
If the extragalactic black
hole sources which make up the X-ray background have such non-thermal tails,
they may account for most of the EGRB in the multi-MeV range.
It should be noted that the extraction of the ~ MeV EGRB from the raw
COMPTEL data is a difficult process, in part owing to the fact
that this
double Compton scattering telescope was not designed to measure this
background. In our opinion, a dedicated low-mass, free flyer satellite,
specifically designed to measure the EGRB at low
-ray energies will be
required in order to accurately determine its characteristics.
4. THE EGRB ABOVE 10 GEV
It has already been pointed out that the EGRB should break above ~ 20 GeV
energy owing to absorption of high energy
-rays by pair-production
interactions with lower energy starlight photons
[16].
There is also another potential cause for a steepening in the EGRB
from blazars. The EGRET detector obtained rough power-law spectral
indeces for blazars in the 0.1 to 10 GeV energy decade, however, we
presently have no data for these objects in the 10 to 100 GeV decade.
Presently popular theoretical models
predict that the spectra of highly luminous blazars will exhibit a cutoff at
energies in the 10 to 100 GeV range, whereas the less luminous X-ray
selected
BL Lac objects can have spectra extending into the TeV energy range
[27],
[28].
Indeed, there have now been ground based detections of at least 5 X-ray
selected BL Lac objects (Weekes, these proceedings),
some of whose spectra extend to multi-TeV energies. While no other types of
blazars have been seen at TeV energies, this may be an result of
intergalactic
-ray absorption
[16],
[29],
[30] so that we
do not really know if
their intrinsic spectra turn down at energies in the 10 to 100 GeV decade.
The GLAST telescope should provide this knowledge in the
not-too-distant future.
If the spectra of most blazars possess intrinsic cutoffs above 10 GeV, then
the EGRB from unresolved blazars would be expected to turn over as well.
This effect should be more dramatic than the steepening in the EGRB
predicted from the effect of intergalactic absorption
[16]. In that case,
if the EGRET results on the EGRB up to 100 GeV are correct, a new
component may be present in this higher energy range. Such a component
has been predicted to be produced by the decay of ~ TeV mass higgs
bosons from cosmic string processes in flat-potential supersymmetric
models [31].
Of course, there may be other unknown possibilities as well.
5. CONCLUSIONS
We have a workable and testable hypothesis for the origin of the
extragalactic
-ray background measured by
EGRET, viz., that it is made up
primarily of unresolved blazars. The GLAST
-ray telescope, to be
flown in the near future, will be able to test this hypothesis in three
ways, i.e., (a) by potentially resolving out and detecting
thousands of
more sources, (b) by measuring the remaining background flux, and (c) by
determining the shape of the EGRB up to TeV energies. The many new
ground-based detectors now under construction will supplement
this information by discovering new extragalactic sources of
-rays of
energies above 50 GeV.
On the other hand, the mystery of the origin of the EGRB in the MeV energy
range must await a better determination of this background by a future
dedicated satellite detector.
REFERENCES
Sreekumar, P. et al.,
Ap.J. 494, 523 (1998).
Kappadath, S.C. et al.
Astron. and Astrophys. Suppl. 120, 691 (1996).
Stecker, F.W. and Salamon, M.H.,
Phys. Rev. Letters 76, 3878 (1996).
Stecker, F.W.,
ApJ 212, 60 (1977).
Hunter, S.D. et al.
ApJ 481, 205 (1997).
Dar, A. and Shaviv, N.J.,
Phys. Rev. Letters 75, 3052 (1995).
Stecker, F.W. and Salamon, M.H.,
ApJ 464, 600 (1996).
Chiang, J. et al.,
ApJ 452, 156 (1995).
Stecker, F.W., Salamon, M.H., and Malkan, M.A.,
ApJ 410, L71 (1993).
Padovani, P. et al.,
MNRAS 260, L21 (1993).
Mücke, A., et al.,
Astron. and Astrophys. Suppl. 120, 541 (1996).
Mattox, J.R., et al.,
ApJ 481, 95 (1997).
Jorstad, S.G. et al., ApJ Suppl., in press,
e-print
astro-ph/0101570 (2001).
Dunlop, J.S. and Peacock, J.A.,
MNRAS 247, 19 (1990).
Thompson, D.J. et al.,
ApJ Suppl. 101, 259 (1995).
Salamon, M.H. and Stecker, F.W.,
ApJ 493, 547 (1998).
Chiang, J. and Mukherjee, R.,
ApJ 493, 547 (1998).
Chiang, J. and Mukherjee, R.,
target="ads_dw">ApJ 496, 752 (1998).
Mukherjee, R., in Proc. Intl. Symp. on High Energy
Gamma-Ray Astronomy, Heidelberg, in press, e-print
astro-ph/0101301.
Mücke, A. and Pohl, M.,
MNRAS 312, 177 (2000).
McNaron-Brown, K. et al.,
ApJ 451, 575 (1995).
The, L.S., Leising, M.D. and Clayton, D.D.,
ApJ 403, 32 (1993).
Watanabe, K., et al.,
ApJ 516, 285 (1999).
Stecker, F.W., Salamon, M.H. and Done, C., e-print
astro-ph/9912106.
Mushotzky, R.F. et al.,
Nature 404, 459 (2000).
Gilli, R., Salvati, M. and Hasinger, G., e-print
astro-ph/0011134.
McConnell, M.L. et al.,
ApJ 543, 928 (2000).
Stecker, F.W., De Jager, O.C. and Salamon, M.H.,
ApJ Letters 473, L75 (1996).
Fossati, G., et al.,
MNRAS 299, 433 (1998).
Stecker, F.W., De Jager, O.C. and Salamon, M.H.,
ApJ Letters 390, L49 (1992).
Stecker, F.W. and De Jager, O.C.,
Astron. and Astrophys. 334, L85 (1998).
Bhattacharjee, P., Shafi, Q. and Stecker, F.W.,
Phys. Rev. Letters 80, 3698 (1998).