


The emission in the different bands of the electro-magnetic spectrum is described in this section, both spectral information and variability are discussed. Figures 2 and 3 give a representative subset of the light curves on which the description of variability is based. These curves are cuts at given frequencies of the data presented in Fig. 1. We give at the end of the section the average overall spectral distribution (the projection of the data in Fig. 1 on the frequency axis). The data shown in Fig. 1 were collected by several groups, they will be described in some details in Türler et al. (in preparation) and made available on the web. In the following, data used and not specifically referenced will be drawn from this collection.
|
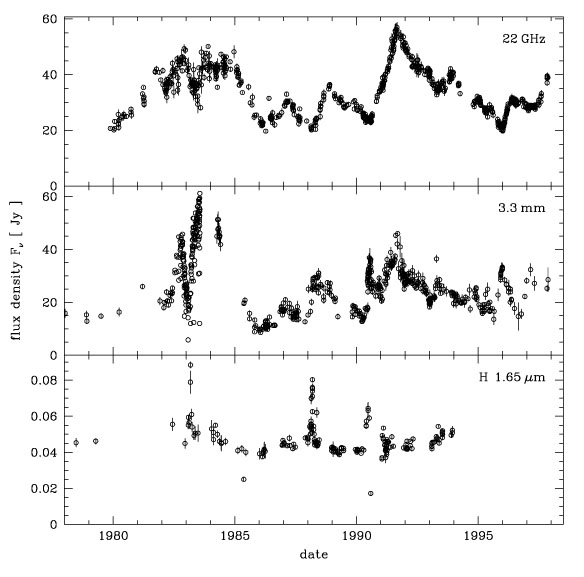
Figure 2. Light curves (flux as a function
of time) for a representative set of frequencies in the radio to
infrared bands. These curves are (up to a factor
|

|
Figure 3. Light curves in the visible ultraviolet and X-ray bands. Data from Fig. 1. The solid line in the lower panel is an extrapolation to 2keV of the BATSE light curve using an average spectral index. |
 ) vertical cuts through