


3.1. Radio Emission
Low frequency (between 4.8 and 14.5GHz) radio observations of several quasars including 3C 273 have been performed regularly at the University of Michigan Radio Astronomy Observatory (UMRAO). These data have been described by [Aller et al. 1985]. A further low frequency monitoring (2.7 and 8.1GHz) from 1979 to 1987 is presented in [Waltman et al. 1991]. The main characteristics of the low frequency emission are a flux of about 40Jy at 8GHz with 2% linear polarization. The light curve shows a broad minimum that lasted approximately 2 years around 1980. At 14.5GHz the flux decreased by a factor 2 at the deepest point.
The variability in this frequency domain is further analysed in [Hughes et al. 1992] in terms of structure functions. It is possible to measure, using structure functions, the longest time on which variability occurs. The structure function
|
N being the number of observations and ti the epoch of
each observation, is given by the average of the square of the difference
of fluxes (f) observed at two epochs separated by
 . The
structure function thus increases as a function of
as long as
is less than the maximum
timescale on which the source varies.
Beyond this maximum timescale the structure function is flat, and
reflects the square of the amplitude of variations. In the case of
3C 273, the low frequency emission variability is
such that the
longest relevant time scale is longer than the data span available for
the analysis, i.e. longer than 10 years.
. The
structure function thus increases as a function of
as long as
is less than the maximum
timescale on which the source varies.
Beyond this maximum timescale the structure function is flat, and
reflects the square of the amplitude of variations. In the case of
3C 273, the low frequency emission variability is
such that the
longest relevant time scale is longer than the data span available for
the analysis, i.e. longer than 10 years.
At higher frequencies (from 22 to 87GHz) a dense and regular monitoring of a sample of active nuclei including 3C 273 is performed at the Metsähovi Radio Research Station. This data set is described in [Teräsranta et al. 1992]. Radio emission at these frequencies shows an increase in the amplitude of the variations as compared to the lower frequencies. At 22 and 37GHz, the flux varies between 20Jy and 60Jy. This amplitude is indeed larger than the factor 2 variability observed at lower frequencies. There are no periods during which the radio emission can be described as "quiescent" onto which "flares" would be superimposed. Rather, variation is the rule and not the exception.
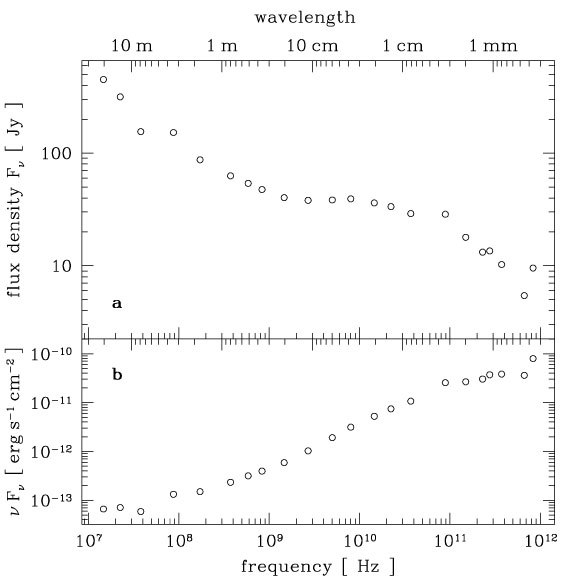
The non thermal character of the radio emission evidenced by the spectral energy distribution (see Fig. 4), the strong variability observed at high radio frequencies and the polarization of the flux are three elements that undoubtedly identify the radio emission mechanism as synchrotron radiation. The variability of the sources is one of the main elements to postulate that the relativistic electrons emitting the synchrotron radiation are generated in shocks associated with the jets (see [Marscher & Gear 1985] and references therein). In this model shocks propagate along the jet from denser to less dense regions. In this process, the frequency at which the perturbed region becomes optically thin decreases with time. It follows that the millimetre emission increases and the frequency of the peak emission is displaced towards lower frequencies. In the next stage, the region expands quasi adiabatically, the radiation losses being less important. Flares are thus described by a flux increase in the millimetre domain that propagates to lower frequencies with time. (See Türler et al in preparation for a 3-dimensional (flux versus time and frequency) representation of the model for average flares).
|
Figure 4. The average radio-millimetre
spectrum. Data from Fig. 1. Top
panel gives the flux
density f |
The spectral energy distribution is more complex than a single power law (Fig. 4). In many AGN the presence of broad humps as seen here at 10GHz is taken as evidence for the presence of cool dust at large distance from the ultraviolet source of the nucleus. Here, the large amplitude of the variability on short timescales (of the order of a year) indicates rather the superposition of several synchrotron components.
It is possible to describe the radio-millimetre flux variations up to frequencies of 100GHz by a set of successive independent events (Türler et al., work in progress) in such a way that the resulting light curves are all well described. Each event is parametrised by a rise time and a decay, a spectrum and the time of the start of the event and its intensity. The decomposition is performed by fitting a set of flares (about 1 per year) simultaneously to more than 10 light curves covering the spectrum from 0.3mm (1000GHz) to 10cm (3GHz) during the last 20 years. This method is able to isolate individual outbursts and to derive their evolution as a function of both time and frequency. Preliminary results show that the observed properties of a typical outburst in 3C 273 are in good qualitative agreement with the predicted properties by shock models in relativistic jet like those of [Marscher & Gear 1985].
 while the bottom panel gives