


11. The anisotropy of the cosmic microwave background radiation
The wonderfully successful CDM prediction of the power spectrum of the angular distribution of the temperature of the 3 K cosmic microwave background radiation has converted many of the remaining skeptics in the cosmology community to the belief that the CDM model likely does capture important elements of reality.
Efstathiou (2002) provides a useful measure of the information in the present measurements (90): the fit to the CDM model significantly constrains three linear combinations of the free parameters. We shall present three sets of considerations that roughly follow Efstathiou's constraints. We begin with reviews of the standard measure of the temperature anisotropy and of the conditions at redshift z ~ 1000 that are thought to produce the observed anisotropy.
The 3 K cosmic microwave background temperature
T( ,
,
 )
as a function of position in the sky usually is expressed as an
expansion in spherical harmonics,
)
as a function of position in the sky usually is expressed as an
expansion in spherical harmonics,
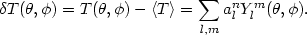 |
(77) |
The square of  T
averaged over the sky is
T
averaged over the sky is
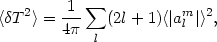 |
(78) |
where |alm|2 is statistically independent of m. This may be rewritten as
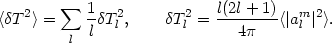 |
(79) |
Since  l-1
is close to
l-1
is close to
 d ln l,
Tl2 is
the variance of the temperature per logarithmic interval of l.
A measure of the angular scale belonging to the multipole index
l is that the minimum distance between
zeros of the spherical harmonic Ylm, in
longitude or latitude, is
=
d ln l,
Tl2 is
the variance of the temperature per logarithmic interval of l.
A measure of the angular scale belonging to the multipole index
l is that the minimum distance between
zeros of the spherical harmonic Ylm, in
longitude or latitude, is
=
 / l, except close to the
poles, where Ylm approaches zero.
(91)
/ l, except close to the
poles, where Ylm approaches zero.
(91)
Now let us consider the main elements of the physics that
determines the 3 K cosmic microwave background anisotropy.
(92)
At redshift zdec ~ 1000 the
temperature reaches the critical value at which the primeval
plasma combines to atomic hydrogen (and slightly earlier to
neutral helium). This removes the coupling between baryons and
radiation by Thomson scattering, leaving the radiation to
propagate nearly freely (apart from residual gravitational
perturbations). Ratios of mass densities near the epoch
zdec when matter and radiation decouple are worth
noting. At redshift zeq = 2.4 × 10⁴
 M0
h2 the mass
density in matter - including the baryonic and nonbaryonic
components - is equal to the relativistic mass density in
radiation and neutrinos assumed to have low masses. At decoupling
the ratio of mass densities is
M0
h2 the mass
density in matter - including the baryonic and nonbaryonic
components - is equal to the relativistic mass density in
radiation and neutrinos assumed to have low masses. At decoupling
the ratio of mass densities is
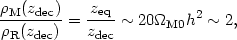 |
(80) |
at the central values of the parameters in Eqs. (6) and (59). The ratio of mass densities in baryons and in thermal cosmic microwave background radiation - not counting neutrinos - is
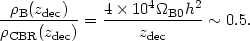 |
(81) |
That is, the baryons and radiation decouple just as the expansion rate has become dominated by nonrelativistic matter and the baryons are starting to lower the velocity of sound in the coupled baryon-radiation fluid (presenting us with still more cosmic coincidences).
The acoustic peaks in the spectrum of angular fluctuations of the 3 K cosmic microwave background radiation come from the Fourier modes of the coupled baryon-radiation fluid that have reached maximum or minimum amplitude at decoupling. Since all Fourier components start at zero amplitude at high redshift - in the growing density perturbation mode - this condition is
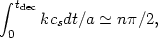 |
(82) |
where cs is the velocity of sound in the baryon-radiation fluid. Before decoupling the mass density in radiation is greater than that of the baryons, so the velocity of sound is close to c / 31/2. The proper wavelength at the first acoustic peak thus is
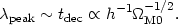 |
(83) |
The parameter dependence comes from Eq. (66).
The observed angle subtended by
 peak is
set by the angular size distance r computed from
zeq to the present (Eq. [71]). If
K0 = 0 or
peak is
set by the angular size distance r computed from
zeq to the present (Eq. [71]). If
K0 = 0 or
 0 = 0 the angular
size distance is
0 = 0 the angular
size distance is
 |
(84) |
If = 0 this
expression is analytic at large zeq.
The expression for
K0 = 0 is
a reasonable approximation to the
numerical solution. So the angular scale of the peak varies with
the matter density parameter as
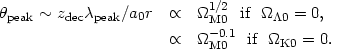 |
(85) (86) |
The key point from these considerations is that the angle defined
by the first peak in the fluctuation power spectrum is sensitive to
M0 if
= 0 (Eq. [85]),
but not if
K0 = 0
(Eq. [86]). (93)
We have ignored the sensitivity of
zdec and tdec to
M0, but
the effect is weak. More detailed computations, which
are needed for a precise comparison with the data, show that the
CDM model predicts that the first and largest peak of
Tl
appears at multipole index lpeak
 220M0-1/2 if
= 0, and at
lpeak
220 if
K0 = 0
and 0.1
220M0-1/2 if
= 0, and at
lpeak
220 if
K0 = 0
and 0.1  M0
1.
(94)
M0
1.
(94)
The measured spectrum
(95) peaks at
Tl ~
80 µK at
l ~ 200, thus requiring small space curvature in the CDM
model. This is the first of Efstathiou's constraints. Because of
the geometric degeneracy this measurement does not yet seriously
constrain
M0 if
K0 = 0.
The second constraint comes from the spectrum of temperature
fluctuations on large scales,
l 30,
where pressure gradient
forces never were very important. Under the scale-invariant initial
conditions discussed in Sec. III.C the
Einstein-de Sitter model predicts
Tl is
nearly independent of
l on large scales. A spatially-flat model with
M0 ~ 0.3,
predicts
Tl
decreases slowly with increasing l at small l.
(96)
The measured spectrum is close to flat at
Tl ~
30 µK, but not well enough constrained for a
useful measure of the parameters
M0 and
0.
(97)
Because of the simplicity of the physics on large angular scales, this
provides the most direct and so perhaps most reliable normalization of the
CDM model power spectrum (that is, the parameter A in
Eqs. [40] and [41]).
The third constraint is the baryon mass density. It affects the
speed of sound cs (Eq. [82]) in the
baryon-radiation fluid prior to decoupling, and the mean free
path for the radiation at z ~ zdec. These in turn
affect the predicted sequence of acoustic peaks (see, e.g.,
Hu and Sugiyama, 1996).
The detected peaks are consistent with
a value for the baryon density parameter
B0 in a
range that includes what is derived from the light elements
elements abundances
(Eqs. [62]). (98)
This impressive check may be much improved by the measurements
of Tl in
progress.
The measurements of
Tl are
consistent with a near scale-invariant power spectrum (Eq. [41]
with n
1) with negligible contribution from gravity
wave or isocurvature fluctuations
(Sec. III.C.1).
The 3 K cosmic microwave background temperature fluctuations
show no departure from a Gaussian random process.
(99)
This agrees with the picture in test (10) for the
nonlinear growth of structure out of Gaussian initial mass
density fluctuations.
The interpretation of the cosmic microwave background temperature
anisotropy measurements assumes and tests general relativity and
the CDM model. One can write down other models for
structure formation that put the peak of
Tl at
about the observed angular scale - an example is
Hu and Peebles (2000)
- but we have seen none so far that seem likely to fit
the present measurements of
Tl.
Delayed recombination of the primeval plasma in an low density
= 0 CDM model
can shift the peak of
Tl to
the observed scale.
(100) The
physics is valid, but the scenario
is speculative and arguably quite improbable. On the other hand,
we cannot be sure a fix of the challenges to CDM reviewed in
Sec. IV.A.2 will not affect our
assessments of such issues, and hence of this cosmological test.
90 Recent measurements are presented in Lee et al. (2001), Netterfield et al. (2002), Halverson et al. (2002), Miller et al. (2002a), Coble et al. (2001), Scott et al. (2002), and Mason et al. (2002). Back.
91 A more careful analysis distinguishes averages across the sky from ensemble averages. By historical accident the conventional normalization replaces 2l + 1 with 2(l + 1) in Eq. (79). Kosowsky (2002) reviews the physics of the polarization of the radiation. Back.
92 The physics is worked out in Peebles and Yu (1970) and Peebles (1982). Important analytic considerations are in Sunyaev and Zel'dovich (1970). The relation of the cosmic microwave background anisotropy to the cosmological parameters is explored in many papers; examples of the development of ideas include Bond (1988), Bond et al. (1994), Hu and Sugiyama (1996), Ratra et al. (1997, 1999), Zaldarriaga, Spergel, and Seljak (1997), and references therein. Back.
93 This "geometrical degeneracy" is discussed by Efstathiou and Bond (1999). Marriage (2002) presents a closer analysis of the effect. Sugiyama and Gouda (1992), Kamionkowski, Spergel, and Sugiyama (1994b), and Kamionkowski et al. (1994a) are early discussions of the cosmic microwave background anisotropy in an open model. Back.
94 Brax et al. (2000) and Baccigalupi et al. (2000) compute the angular spectrum of the cosmic microwave background anisotropy in the dark energy scalar field model. Doran et al. (2001) discuss the angular scale of the peaks in this case, and Corasaniti and Copeland (2002), Baccigalupi et al. (2002), and references therein, compare model predictions and observations - it is too early to draw profound conclusions about model viability, and new data are eagerly anticipated. Wasserman (2002) notes that the cosmic microwave background anisotropy data could help discriminate between different dark energy scalar field models whose predictions do not differ significantly at low redshift. Back.
95 For analyses see Knox and Page (2000), Podariu et al. (2001), Wang, Tegmark, and Zaldarriaga (2002), Durrer, Novosyadlyj, and Apunevych (2001), Miller et al. (2002b), and references therein. Back.
96 The physics was first demonstrated by Sachs and Wolfe (1967) and applied in the modern context by Peebles (1982). The intermediate Sachs-Wolfe effect that applies if the universe is not Einstein-de Sitter is shown in Eq. (93.26) in Peebles (1980). This part of the Sachs-Wolfe effect receives a contribution from the low redshift matter distribution, so cross-correlating the observed large-scale cosmic microwave background anisotropy with the low redshift matter distribution could provide another test of the world model (Boughn and Crittenden, 2001, and references therein). Back.
97 See, e.g., Górski et al. (1998). This ignores the "low" value of the cosmological quadrupole (l = 2) moment, whose value depends on the model used to remove foreground Galactic emission (see, e.g., Kogut et al., 1996). Contamination due to non-cosmic microwave background emission is an issue for some of the anisotropy data sets (see, e.g., de Oliveira-Costa et al., 1998; Hamilton and Ganga, 2001; Mukherjee et al., 2002, and references therein). Other issues that need care in such analyses include accounting for the uncertainty in the calibration of the experiment (see, e.g., Ganga et al., 1997; Bridle et al., 2001), and accounting for the shape of the antenna pattern (see, e.g., Wu et al., 2001a; Souradeep and Ratra, 2001; Fosalba, Dore, and Bouchet, 2002). Back.
98 The
B0
h2 values estimated from the cosmic microwave background
anisotropy measured by
Netterfield et al. (2002),
Pryke et al. (2002), and
Stompor et al. (2001),
are more consistent with the higher, deuterium based,
Burles et al. (2001)
range in Eqs. (62).
Back.
99 Colley, Gott, and Park (1996) present an early discussion of the situation on large angular scales; more recent discussions are in Mukherjee, Hobson, and Lasenby (2000), Phillips and Kogut (2001), and Komatsu et al. (2002). Degree and sub-degree angular scale anisotropy data are studied in Park et al. (2001), Wu et al. (2001b), Shandarin et al. (2002), and Polenta et al. (2002). Back.
100 The model in
Peebles, Seager, and Hu
(2000)
assumes stellar ionizing radiation at z ~ 1000 produces
recombination Lyman  photons. These resonance photons
promote photoionization from the n = 2 level of atomic hydrogen.
That allows delayed recombination with a rapid transition to
neutral atomic hydrogen, as required to get the shape of
Tl
about right. Back.
photons. These resonance photons
promote photoionization from the n = 2 level of atomic hydrogen.
That allows delayed recombination with a rapid transition to
neutral atomic hydrogen, as required to get the shape of
Tl
about right. Back.