


2.4. Luminosity function of galaxies
The luminosity function of galaxies in a cluster gives the number
distribution of
the luminosities of the galaxies. The integrated luminosity function
N(L) is the
number of galaxies with luminosities greater than L, while the
differential
luminosity function n(L)dL is the number of
galaxies with luminosities in the
range L to L + dL. Obviously, n(L)
 -dN(L) /
dL. Luminosity functions are
often defined in terms of galaxy magnitudes m
-dN(L) /
dL. Luminosity functions are
often defined in terms of galaxy magnitudes m
 -2.5 log
10(L);
N(
-2.5 log
10(L);
N( m) is the
number of galaxies in a cluster brighter than magnitude
m. Observational studies of the luminosity functions of clusters
include
Zwicky (1957),
Kiang (1961),
van den Bergh (1961a),
Abell (1962,
1975,
1977),
Rood (1969),
Gudehus (1973),
Bautz and Abell (1973),
Austin and Peach (1974b),
Oemler (1974),
Krupp (1974),
Austin et al.
(1975),
Godwin and Peach (1977),
Mottmann and Abell
(1977),
Dressler (1978b),
Bucknell et al.
(1979),
Carter and Godwin
(1979),
Thompson and Gregory
(1980),
and Kraan-Korteweg
(1981).
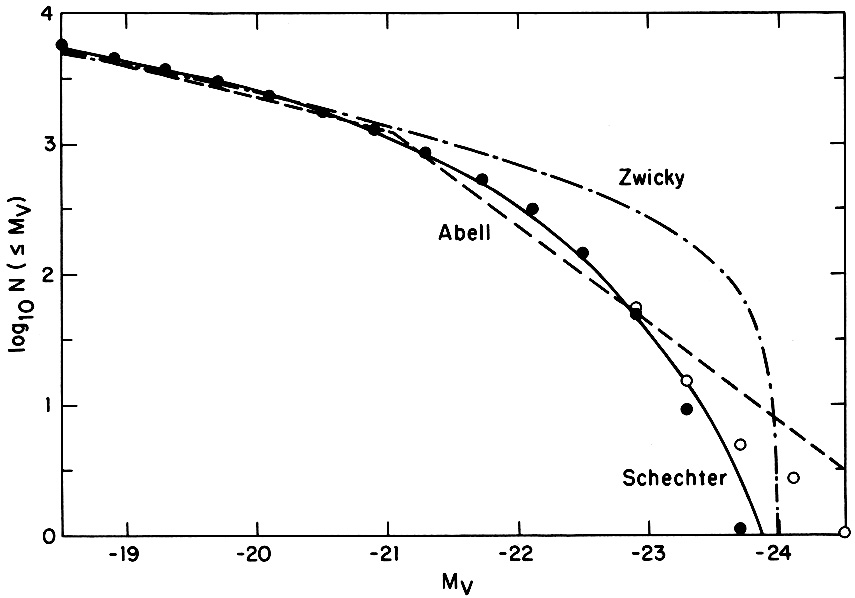
Figure 2 gives the observed integrated
luminosity function for a composite of 13 rich clusters as derived by
Schechter (1976)
from Oemler's (1974)
data.
m) is the
number of galaxies in a cluster brighter than magnitude
m. Observational studies of the luminosity functions of clusters
include
Zwicky (1957),
Kiang (1961),
van den Bergh (1961a),
Abell (1962,
1975,
1977),
Rood (1969),
Gudehus (1973),
Bautz and Abell (1973),
Austin and Peach (1974b),
Oemler (1974),
Krupp (1974),
Austin et al.
(1975),
Godwin and Peach (1977),
Mottmann and Abell
(1977),
Dressler (1978b),
Bucknell et al.
(1979),
Carter and Godwin
(1979),
Thompson and Gregory
(1980),
and Kraan-Korteweg
(1981).
Figure 2 gives the observed integrated
luminosity function for a composite of 13 rich clusters as derived by
Schechter (1976)
from Oemler's (1974)
data.
|
Figure 2. The luminosity function of
galaxies in clusters.
N( |
Three types of functions are commonly used for fitting the luminosity function. Zwicky (1957) proposed the form

| (2.1) |
where K is a constant and m1 is the
magnitude of the first brightest galaxy.
In general, the Zwicky function fits the faint end of the luminosity
function
adequately, but does not fall off rapidly enough for brighter galaxies
(see Figure 2). Clearly, equation (2.1) implies
that N(L)
= K[(L1 / L)1/2 - 1], where
L1 is the
luminosity of the first brightest galaxy, and K is the expected
number of galaxies in the range 1/4 L1
L
L1.
Abell (1975)
has suggested that the luminosity function N(L) be fit by two
intersecting power laws, N(L) =
N*(L /
L*)- , where
 5/8 for L <
L*, and
15/8 for L
> L*. L* is the
luminosity at which the two power laws cross, and
N* is the expected number of galaxies with
L
5/8 for L <
L*, and
15/8 for L
> L*. L* is the
luminosity at which the two power laws cross, and
N* is the expected number of galaxies with
L  L*. Of course, this form is
intended only as a simple and practical fit to the data; the real luminosity
function certainly has a continuous derivative n(L),
unlike Abell's function. The
magnitude luminosity function corresponding to Abell's form is often written
as
L*. Of course, this form is
intended only as a simple and practical fit to the data; the real luminosity
function certainly has a continuous derivative n(L),
unlike Abell's function. The
magnitude luminosity function corresponding to Abell's form is often written
as
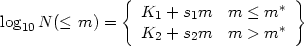
| (2.2) |
where K1 and K2 are constants. The
slopes are approximately s1
0.75 and
s2
0.25, and the power laws cross at m =
m*, so that K1 +
s1 m* =
K2 + s2 m*.
As shown in Figure 2, the Abell form fits both the bright and faint ends
of the luminosity function adequately.
Schechter (1976) proposed an analytic approximation for the differential luminosity function

| (2.3) |
where L* is a characteristic luminosity,
N*
 (1 -
, 1) is the number of
galaxies with L > L*, and
(a, x) is the
incomplete gamma function; Schechter derives a value for the faint end
slope of = 5/4. The
integrated luminosity
function corresponding to equation (2.3) is N(L) =
N*
(1 -
,
L/L*).
(1 -
, 1) is the number of
galaxies with L > L*, and
(a, x) is the
incomplete gamma function; Schechter derives a value for the faint end
slope of = 5/4. The
integrated luminosity
function corresponding to equation (2.3) is N(L) =
N*
(1 -
,
L/L*).
The advantages of the Schechter function are that it is analytic and continuous, unlike Abell's form, and that it is a real statistical distribution function, unlike Zwicky's form, which requires that the magnitude of the first brightest galaxy (which ought to be a random variable) be specified. An expression similar to the Schechter form was predicted by a simple analytical model for galaxy formation (Press and Schechter, 1974). The Schechter function is steeper than Abell's function at the bright end because it contains an exponential. The Schechter differential luminosity function decreases monotonically with luminosity, while the Abell function has a local maximum at L = L* (Abell, 1975); there is some weak evidence for such a peak, especially near the centers of rich clusters (Rood and Abell, 1973).
The Schechter function fits the observed distribution in many clusters reasonably well from the faint to the bright end (Figure 2), as long as the very brightest galaxies, the cD galaxies, are excluded (Schechter, 1976). These can have luminosities as large as 10L*, and thus are extremely improbable if equation (2.3) holds exactly. However, cD galaxies have a number of distinctive morphological characteristics which suggest that they were formed by special processes which occur primarily in the centers of rich clusters (see Section 2.10.1). In any case, they apparently can be excluded by morphological (as opposed to luminosity) criteria, and equation (2.3) can be taken to be the non cD luminosity function.
The parameter N* in the Abell or Schechter
functions is a useful measure of
the richness of the cluster. If these luminosity functions are adequate
approximations, then fitting the luminosity function to determine
N* ought to
give a more accurate measure of richness than counting galaxies in magnitude
ranges. Note that while the total number of galaxies predicted by Abell's,
Zwicky's, or Schechter's functions diverges at the faint end, the total
luminosity is finite; for example, the total cluster optical luminosity is
Lopt = N*
(2 -
)
L* for the Schechter function, and
N* thus measures the total cluster luminosity.
Because of the break in the luminosity function near
L*, this parameter
represents a characteristic luminosity of cluster galaxies. Moreover,
L* is nearly
the same for many clusters; it corresponds to an absolute visual magnitude
MV* -21.2 + 5 log
10 h50 for Abell's form
(Austin et al.,
1975),
and MV*
-21.9 + 5 log
10h50 for Schechter's form
(Schechter, 1976).
By comparing these values with the apparent magnitude
m* derived from
the observed luminosity function of a cluster, one can derive a distance
estimate for the cluster
(Bautz and Abell, 1973;
Schechter and Press,
1976).
Unfortunately, this requires that magnitudes be available for a large
number of galaxies.
The magnitude of the brightest galaxy in a cluster has often been used as a distance indicator in cosmological studies (see, for example, Hoessel, Gunn, and Thuan, 1980). It is obviously easier to determine observationally than the luminosity function. Moreover, the luminosities of the brightest cluster galaxies show a very small variation from cluster to cluster (Sandage, 1976) and depend only weakly on richness. There has been a controversy concerning whether the luminosities of these brightest galaxies are determined statistically by the cluster luminosity function, or whether the brightest galaxies are produced by some special physical processes operating in clusters (see Dressler, 1984, for a review). Under the statistical hypothesis, all of the galaxy luminosities are random variables drawn from the luminosity function (Geller and Peebles, 1976). Then, the observed number of galaxies in any luminosity range will have a Poisson distribution about the expectation given by the luminosity function, and the luminosity L1 of the brightest galaxy will thus be distributed as exp[-N(L1)] n(L1)dL1. As N(L1) is proportional to richness, the statistical model predicts that L1 increases with cluster richness, which is not really observed (Sandage, 1976). However, Schechter and Peebles (1976) have argued that the near constancy of L1 results from a selection effect (that is, the observed sample is biased), and that the statistical hypothesis may still be valid.
Alternatively, the brightest cluster galaxies may be affected by special physical processes, such as the tidal interactions or mergers of galaxies (Peach, 1969; Ostriker and Tremaine, 1975; Hausman and Ostriker, 1978; Richstone, 1975). Evidence that this may indeed be the case is given in Section 2.10.1.
While the luminosity functions of many clusters are reasonably well
represented by the Schechter or Abell form with a universal value of
M*,
significant departures exist in a number of clusters
(Oemler, 1974;
Mottmann and Abell,
1977;
Dressler, 1978b).
These departures include variations in the value of
M*, variations in the slope of the faint end
of the luminosity function
( in
Schechter's form, equation (2.3)), and variations in the steepness of
the bright end of the luminosity function
(Dressler, 1978b).
These variations are, in many cases, correlated with cluster morphology
(Section 2.5). The
variations in M* and
probably reflect
variations in the conditions in
the cluster at its formation, while the variations in the bright end slope
may result from evolutionary changes, such as the tidal interaction or
merging of massive galaxies
(Richstone, 1975;
Hausman and Ostriker,
1978).
In particular, the clusters with the steepest luminosity functions at
the bright end often contain cD galaxies
(Dressler, 1978b);
this may
indicate that the brighter galaxies were either eliminated by mergers to
form the cD or diminished in brightness through tidal stripping
(Section 2.10.1).
Turner and Gott (1976a) have shown that the luminosity function of galaxies in small groups is well represented by equation (2.3). In fact, Bahcall (1979a) has suggested that the luminosity function of all galaxian systems - from single galaxies (in or out of clusters) to the groups and clusters themselves - can be fit in a single function similar to the Schechter form (equation 2.3).