Copyright © 1998 by Annual Reviews. All rights reserved
| Annu. Rev. Astron. Astrophys. 1998. 36:
17-55 Copyright © 1998 by Annual Reviews. All rights reserved |


2.1. Homogeneity and Diversity
Much has been written, pro and con, about the observational homogeneity of SNe Ia, and for the most part the discussion has followed a natural course. Before the 1990s and even in 1992 (Branch & Tammann 1992), when most of the mild apparent differences among SNe Ia were comparable to the observational errors, the striking observational homogeneity was emphasized, although it already was clear both photometrically (Phillips et al 1987) and spectroscopically (Branch et al 1988) that SNe Ia are not strictly homogeneous. After the discovery of the obviously deviant SNe 1991T and 1991bg, it became necessary to split SNe Ia into a majority of normal events and a minority of peculiar ones. In the 1990s, the observational data have improved so much that it has become possible to look seriously at the diversity even among normal SNe Ia. This has brought about a natural new emphasis on the diversity - but it would be a mistake to lose sight of the fact that even as the new data have illuminated the diversity, they also have confirmed that normal SNe Ia are highly homogeneous. When made in the context of using SNe Ia to determine H0, statements such as "SNe Ia are far from standard candles" and "the concept of a normal SN Ia is without merit" do more to obscure than to illuminate the reality.
It is clear and uncontroversial that events like SN 1991bg and to a lesser extent SN 1986G are "weak" explosions. They can be readily distinguished from normal SNe Ia on the basis of practically any spectroscopic or photometric observable, so although they are very interesting physically, they need have no bearing on the determination of H0. Even if these intrinsically red, dim events did not exist, we would still have to deal with red, dim, extinguished events. Coping with events like SN 1991T is less straightforward, but they are uncommon and do not pose a serious problem for H0. In the rest of this section we consider the distributions of various observational properties of SNe Ia, with some emphasis on the extent to which the normal events are homogeneous and diverse.
2.1.1. SPECTRA Observational aspects of SN spectra and their classification have been reviewed in this series by Filippenko (1997). Given a decent spectrum, deciding whether an event is or is not a Type Ia is practically always unambiguous (except at high redshift). Spectra of three normal SNe Ia and the peculiar SNe 1991T, 1991bg, and 1986G, all near maximum light, are displayed in the right panel of Figure 1 (see Section 4.4 for discussion of the left panel). Normal SNe Ia undergo a characteristic spectral evolution, showing P Cygni lines of Si II, Ca II, S II, O I, and Mg II prior to and near maximum light, developing blends of P Cygni permitted Fe II lines shortly thereafter, and finally developing blends of forbidden emission lines of iron and cobalt ions during the late nebular phase. The most conspicuous spectroscopic peculiarity of weak events like SNe 1991bg and 1986G during their photospheric phase is that they show a broad absorption trough around 4200 Å, produced by low-excitation Ti II lines (Filippenko et al 1992a). In SN 1991T, prior to and around maximum light, high-excitation lines of Fe III were prominent (Ruiz-Lapuente et al 1992, Filippenko et al 1992b). By a few weeks after maximum light, the spectra of SN 1991T looked nearly normal.
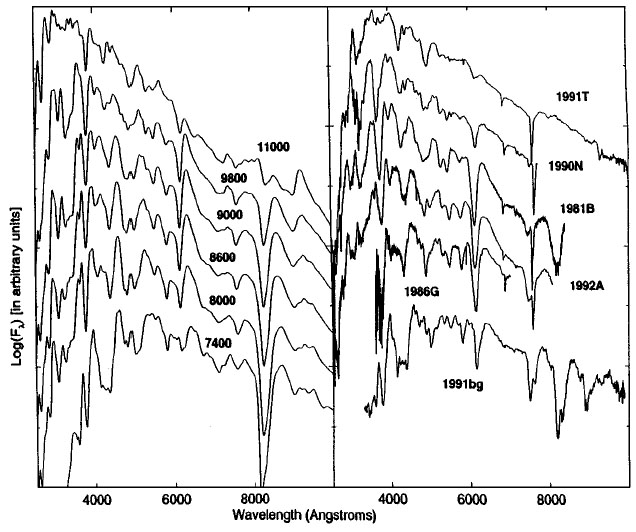 |
Figure 1. Nonlocal thermodynamic equilibrium (NLTE) spectra calculated for the composition structure of model W7, 15 days after explosion and a range of effective temperatures (left), and observed spectra of SNe Ia near maximum light (right). From Nugent et al (1995c). |
Looking at line spectra is a good way to study diversity because the strengths and blueshifts of the lines (in the SN rest frame) are not affected by extinction or distance. In terms of the general appearance of their spectral features, most SNe Ia look very similar. For a beautiful illustration of what is meant by SN Ia spectral homogeneity, see figure 6 of Filippenko (1997). Branch et al (1993) defined what they meant by spectroscopically normal (like SNe 1981B, 1989B, 1992A, and 1972E) and peculiar (like SNe 1986G, or 1991bg, or 1991T) and then found that 83 to 89% of the SNe Ia whose spectra they were able to subclassify were normal. Subtle differences in the spectra of normal SNe Ia were nevertheless evident. As more SN Ia spectra have been published [Gómez et al (1996) set a record by presenting spectra of 27 different SNe Ia in one paper], the situation has not changed: Most SNe Ia in the observational sample are spectroscopically normal in the sense of Branch et al (1993).
Spectroscopic diversity can be quantified by measuring blueshifts of
absorption features or monochromatic flux ratios.
Branch & van den Bergh
(1993)
compiled data on the wavelength of the absorption minimum near 6100
Å during the photospheric phase of 36 SNe Ia and converted to
velocity on the assumption that the feature is produced by blueshifted
 6355 of Si II. It
should be noted that
Fisher et al (1997)
suggested that in pre-maximum spectra, this absorption feature may be
partially produced by
6580 of C II; if this is correct, then some of the velocities derived on
the basis of the Si II identification will need to be revised. In any case
the measured differences in the feature wavelength at a given phase exceed
the observational uncertainties.
Branch & van den Bergh
(1993)
defined a parameter V10 (Si), the blueshift at 10 days
after maximum light (late enough to be unaffected by C II). SNe Ia have
8,000 < V 10(Si) < 14,000 km
s-1. Weak SNe Ia tend to have the very lowest values, but
there also are definite differences among normal SNe Ia.
6355 of Si II. It
should be noted that
Fisher et al (1997)
suggested that in pre-maximum spectra, this absorption feature may be
partially produced by
6580 of C II; if this is correct, then some of the velocities derived on
the basis of the Si II identification will need to be revised. In any case
the measured differences in the feature wavelength at a given phase exceed
the observational uncertainties.
Branch & van den Bergh
(1993)
defined a parameter V10 (Si), the blueshift at 10 days
after maximum light (late enough to be unaffected by C II). SNe Ia have
8,000 < V 10(Si) < 14,000 km
s-1. Weak SNe Ia tend to have the very lowest values, but
there also are definite differences among normal SNe Ia.
For a small sample of 12 SNe Ia, Fisher et al (1995) defined a parameter VR(Ca) that is based on the wavelength of the red edge of the Ca II H&K absorption feature at moderately late times and intended as a measure of the minimum ejection velocity of calcium. The weak SNe 1991bg and 1986G had exceptionally low VR(Ca) values, 1600 and 2700 km s-1, respectively, while normal SNe Ia had 4000 < VR(Ca) < 7300 km s-1. For a sample of 8 SNe Ia, Nugent et al (1995c) defined parameters R(Si), based on the relative depths at maximum light of the Si II absorption features near 5800 and 6150 Å, and R(Ca), based on the relative heights of the emission peaks on both sides of the Ca II H&K absorption feature. Again, SN 1991bg and to a lesser extent SN 1986G had extreme values of both parameters, and clear differences were observed among the normal SNe Ia.
Thus, on the basis of the general appearance of their spectra, SNe Ia can be divided into a majority of normals and a minority of peculiars. When spectral features are quantified, peculiar weak events have extreme values of the parameters. Moderate spectral diversity among normal SNe Ia also exists, and given good data, it can be quantified in various ways.
2.1.2. LIGHT-CURVE SHAPES
Like spectra, rest-frame light-curve shapes are independent
of distance and of extinction (to first order). And like SN Ia spectra, SN
Ia light-curve shapes are impressively homogeneous
(Hamuy et al 1991,
Leibundgut et al
1991b,
Branch & Tammann
1992). The first obviously deviant light curves were those of
SN 1986G
(Phillips et al
1987),
which was fast, and SN 1991bg
(Filippenko et al
1992a,
Leibundgut et al 1993),
which was faster. Now that good photometry is available for numerous SNe
Ia, more moderate differences among light curves can be studied. The
parameter that most often has been used to quantify light-curve shapes
is  m15
(Phillips 1993),
the magnitude decline in the B band during the first 15 days
after maximum light. Often, when the data for a direct measurement of
m15 are not available, a value is assigned by fitting
the data to template light curves of SNe Ia having various values of
m15.
Hamuy et al (1996d)
presented a set of six templates in the B, V, and I bands,
ranging from the rather slow light curves of SNe 1992bc
(
m15 = 0.87) and 1991T
(
m15 = 0.94) to the very rapid ones of SN 1991bg
(
m15 = 1.93). The SN 1992A light curves
(
m15 = 1.47) are shown in
Figure 2 as an example of superb photometric
data, and a comparison of the shapes of the six templates is shown in
Figure 3. Light-curve shape diversity exists,
and given good data, it can be quantified.
m15
(Phillips 1993),
the magnitude decline in the B band during the first 15 days
after maximum light. Often, when the data for a direct measurement of
m15 are not available, a value is assigned by fitting
the data to template light curves of SNe Ia having various values of
m15.
Hamuy et al (1996d)
presented a set of six templates in the B, V, and I bands,
ranging from the rather slow light curves of SNe 1992bc
(
m15 = 0.87) and 1991T
(
m15 = 0.94) to the very rapid ones of SN 1991bg
(
m15 = 1.93). The SN 1992A light curves
(
m15 = 1.47) are shown in
Figure 2 as an example of superb photometric
data, and a comparison of the shapes of the six templates is shown in
Figure 3. Light-curve shape diversity exists,
and given good data, it can be quantified.
 |
Figure 2. Light curves of SN 1992A. From Hamuy et al (1996d). |
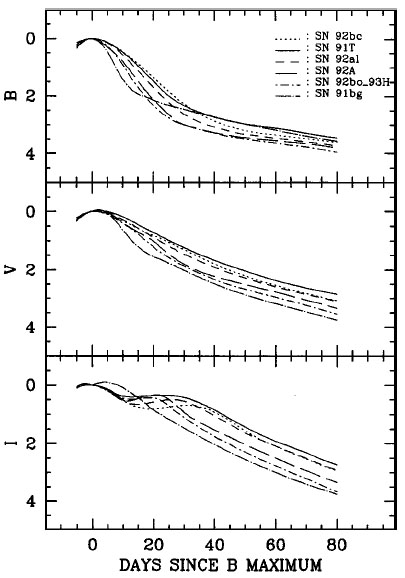 |
Figure 3. Comparison of six light-curve templates. From Hamuy et al (1996d). |
2.1.3. COLORS AND ABSOLUTE MAGNITUDES
Colors and absolute magnitudes are
both affected by interstellar extinction, so I discuss them together. A
source of confusion in the past was that a few SNe Ia were reported to
be very blue at maximum light, with B - V
 - 0.3. (Throughout this article B - V is the difference
between the peak B and peak V values, i.e. it is really
Bmax - Vmax). This implied either a
wide range in intrinsic color among
normal SNe Ia or a characteristic very blue intrinsic color with
considerable
interstellar reddening as the norm rather than the exception. However, CCD
photometry of comparison stars that were used for the old photographic
photometry has confirmed a previous suspicion that the "too-blue" colors
were in error
(Patat et al 1997),
and now the color distribution of SNe Ia is strongly peaked near
B - V = 0. The minority of events that have much redder
values include some like SN 1989B (B - V = 0.35), which
were intrinsically normal but obviously reddened by dust, and weak
events like SN 1991bg (B - V = 0.87), which were
intrinsically red. That most SNe Ia should escape
severe extinction in their parent galaxies is not surprising
(Hatano et al 1998).
In addition, of course, observational selection works against the discovery
and follow-up of the small fraction of SNe Ia that do happen to be severely
extinguished.
- 0.3. (Throughout this article B - V is the difference
between the peak B and peak V values, i.e. it is really
Bmax - Vmax). This implied either a
wide range in intrinsic color among
normal SNe Ia or a characteristic very blue intrinsic color with
considerable
interstellar reddening as the norm rather than the exception. However, CCD
photometry of comparison stars that were used for the old photographic
photometry has confirmed a previous suspicion that the "too-blue" colors
were in error
(Patat et al 1997),
and now the color distribution of SNe Ia is strongly peaked near
B - V = 0. The minority of events that have much redder
values include some like SN 1989B (B - V = 0.35), which
were intrinsically normal but obviously reddened by dust, and weak
events like SN 1991bg (B - V = 0.87), which were
intrinsically red. That most SNe Ia should escape
severe extinction in their parent galaxies is not surprising
(Hatano et al 1998).
In addition, of course, observational selection works against the discovery
and follow-up of the small fraction of SNe Ia that do happen to be severely
extinguished.
For the distribution of peak absolute magnitudes, relative
distances are required. On the basis of a sample that included data from
Hamuy et al (1995b)
as well as some earlier less accurate data,
Vaughan et al (1995),
Tammann & Sandage
(1995)
stressed that when a simple B - V criterion is used to
exclude SNe Ia that are observationally red,
whether intrinsically or because of dust, one is left with a sample of
nearly standard candles. This has been confirmed by
Hamuy et al (1996b).
The top panel of Figure 4 shows the
Hubble diagram in V for the 26 events in their sample having
B - V < 0.2 (see
Section 2.2 for discussion of the bottom
panel). The observational absolute-magnitude dispersions of these
events are only
 obs(MB) = 0.24,
obs(MV) = 0.22, and
obs(M -
I) = 0.19. Applying a color cut is a very straightforward strategy
for obtaining a sample of nearly standard candles, but it can be
misunderstood
(von Hippel et al
1997).
The mean absolute magnitudes, corrected for Galactic but not
parent-galaxy extinction, of the 26 events of
Hamuy et al (1996b)
that pass the color cut are
obs(MB) = 0.24,
obs(MV) = 0.22, and
obs(M -
I) = 0.19. Applying a color cut is a very straightforward strategy
for obtaining a sample of nearly standard candles, but it can be
misunderstood
(von Hippel et al
1997).
The mean absolute magnitudes, corrected for Galactic but not
parent-galaxy extinction, of the 26 events of
Hamuy et al (1996b)
that pass the color cut are
 |
(1) |
Saha et al (1997)
show a Hubble diagram (their figure 10) for a larger sample of 56 SNe Ia
that includes some more recent data
(Riess 1996)
but also some older data that are not as precise as those of
Hamuy et al (1996b);
therefore, the dispersions for the Saha et al sample are somewhat
higher,
obs(MB) = 0.33 and
obs(MV) = 0.31.
Wang et al (1997a)
point out that the scatter in the absolute magnitudes, uncorrected for
extinction, of SNe Ia beyond about 7.5 kpc from the centers of their
parent galaxies is very small; unfortunately, none of the
Cepheid-calibrated SNe Ia discussed in
Section 3 were that far out.
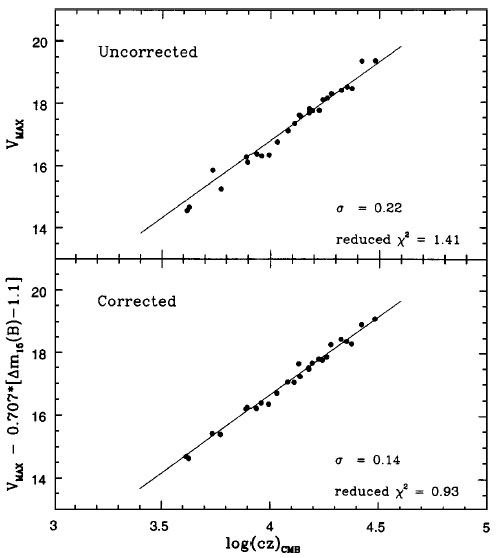 |
Figure 4. The Hubble diagram in V
for the 26 SNe Ia in the Calán-Tololo sample having B -
V |
Figure 5 shows absolute magnitude plotted against B - V for the Calán-Tololo sample. For the entire sample, including the weak SN 1992K that resembled SN 1991bg (Hamuy et al 1995a), the weak 1993H that probably was like SN 1986G (Hamuy et al 1996b), and the moderately extinguished SN 1990Y (Hamuy et al 1995), a correlation is obvious, and even when the three red events are excluded a correlation remains. In the past, the correlation between color and absolute magnitude seemed to require that the extinction characteristics of the dust that reddens SNe Ia in external galaxies differ from those of the dust in our Galaxy (Branch & Tammann 1992 and references therein). Recently this problem has been thought to have been due to the old "too-blue" SNe Ia mentioned above and to the adoption of a single intrinsic value of B - V for SNe Ia (Della Valle & Panagia 1992, Sandage & Tammann 1993, Vaughan et al 1995, Riess et al 1996b). Strangely enough, the mystery appears to have resurfaced (Tripp 1998).
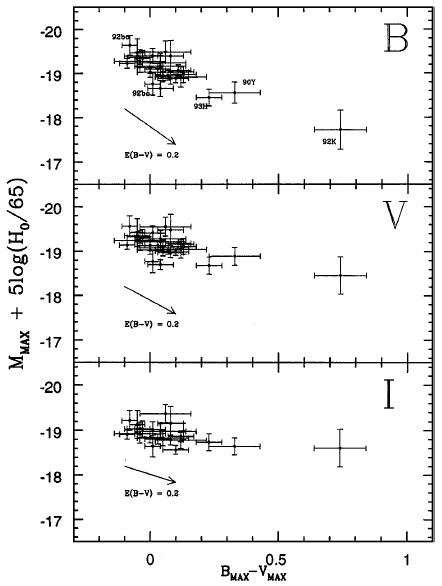 |
Figure 5. Absolute magnitudes of the Calán-Tololo sample are plotted against B - V. The extinction vectors have conventional slopes of 4.1 in B, 3.1 in V, and 1.85 in I. From Hamuy et al (1996b). |
 0.20
(top), and after correction for a magnitude-decline correlation
(bottom). From
0.20
(top), and after correction for a magnitude-decline correlation
(bottom). From