


The radio-IR correlation can be written in a general form as:
 |
(1) |
where LIR is the IR luminosity of the galaxy,
P () is the specific radio luminosity
at the radio frequency , and
() is the specific radio luminosity
at the radio frequency , and
 and
and
 are
coefficients that depend on the frequency at which the correlation is
expressed. The coefficient
is dimensional, and its
value depends on the units used in the correlation. The presentation
above is often referred to as the
{P-LIR}
presentation of the radio-IR correlation. An alternative is the
{S-FIR}
presentation, in which the radio and IR outputs are expressed in units
of W m-2 Hz-1 and W m-2, respectively.
are
coefficients that depend on the frequency at which the correlation is
expressed. The coefficient
is dimensional, and its
value depends on the units used in the correlation. The presentation
above is often referred to as the
{P-LIR}
presentation of the radio-IR correlation. An alternative is the
{S-FIR}
presentation, in which the radio and IR outputs are expressed in units
of W m-2 Hz-1 and W m-2, respectively.
The two presentations are, of course, equivalent for individual
galaxies. However, for determining
, the choice
of presentation is important if
is a priori
known to be different from unity
(Cox et al. 1988).
If all galaxies lie on a line of slope
= 1 in a
log-log S
vs. FIR plot, then the conversion to a
{P-LIR}
presentation will move them up or down along a diagonal line, leaving
the overall slope of the correlation unchanged. However, if the slope of
the correlation is different from unity in a
{S-FIR}
presentation, then fainter galaxies, which tend to be more distant than
brighter ones, may move systematically away or toward the
= 1 slope
line in a
{P-LIR}
presentation. The overal effect will be to flatten the slope if
< 1, and
to steepen it if
> 1 in a
transition from a
{S-FIR}
to a
{P-LIR}
presentation.
Various investigators examined the radio-IR correlation using a variety of sample selection criteria. All use FIR fluxes measured by the IRAS satellite and construct galaxy FIR luminosities (fluxes) from the 60 and 100 µm detections using the following relation (Sanders & Mirabel 1996):
 |
(2) |
where S and
L are flux and
luminosity densities expressed in units of Jy ( = 10-26 W
m-2 Hz-1) and
L / Hz,
respectively.
/ Hz,
respectively.
As we will show in Section 3, the value of
plays an
important role in quantifying the CIB-CRB connection. A value of
that is
significantly different from unity will require detailed knowledge of
the evolution of the IR luminosity function with redshift, whereas a
value of unity will considerably simplify the relation between the two
background emissions. We therefore briefly review previous
determinations of
.
Initial investigations, using a relatively small sample of 91
radio-selected galaxies observed at
= 4.8 GHz
(de Jong et al. 1985)
and 38 optically- and radio- selected galaxies observed at 1.4 GHz
(Helou, Soifer, &
Rowan-Robinson 1985),
found the radio-IR correlation to be linear.
Wunderlich & Klein
(1988)
extended the analysis of
de Jong et al. (1985)
to a wider range of galaxy types, covering about 4 orders of magnitudes
in FIR luminosities. They found that the correlation at
= 4.8 GHz is approximately
linear
( = 0.99
± 0.38) up to IR luminosities of 9.1 × 10⁹
L, with
increasing
to a value of
1.26 ± 0.33 at higher luminosities. However, we found that their
sample of galaxies could also be fitted with a single power law with a
slope of
= 1.05
± 0.03.
Devereux and Eales (1989)
correlated the 1.49 GHz power with the FIR output from an optically
selected sample of galaxies with luminosities between
 108 -
1011
L. They found
the slope of the correlation to be significantly larger than unity with
a value of
= 1.28. A
similar conclusion was reached by
Cox et al. (1988)
who studied the correlation for a flux limited sample of 74 radio
galaxies at 151 MHz. They found
= 1.32
± 0.06 in a
{S-FIR}
presentation, and = 1.15 ± 0.04 in a
{P-LIR}
presentation of the data, and adopted an average slope of
= 1.23.
108 -
1011
L. They found
the slope of the correlation to be significantly larger than unity with
a value of
= 1.28. A
similar conclusion was reached by
Cox et al. (1988)
who studied the correlation for a flux limited sample of 74 radio
galaxies at 151 MHz. They found
= 1.32
± 0.06 in a
{S-FIR}
presentation, and = 1.15 ± 0.04 in a
{P-LIR}
presentation of the data, and adopted an average slope of
= 1.23.
Chi & Wolfendale (1990)
provided theoretical arguments why the slope of the radio-IR correlation
should not be unity. They predicted a break in the slope of the
correlation at an IR luminosity above which most of the electrons
producing the radio synchrotron emission remained trapped in the
galaxy. For these galaxies the slope of the correlation should be unity,
but for the smaller and less IR luminous galaxies they argued that
should be
larger than unity. They claimed to have found evidence for this effect
in the data and reported values of
= 1.37 for
low luminosity galaxies, a trend exactly opposite to that found by
Wunderlich & Klein
(1988).
Our analysis of the Chi & Wolfendale sample did not confirm either
trend. We found that their data could be represented by a single slope
with a value of
= 1.27
± 0.06.
Condon, Anderson, &
Helou (1991;
hereafter CAH91) reexamined the radio-IR correlation using the
IRAS revised bright galaxies sample (BSG) from which
spectroscopically identified AGN were subtracted, and which were
detected with the VLA at 1.49 GHz. They found the slope of the
correlation to be significantly greater than unity with a smaller value
of = 1.11
± 0.02 over the ~ 109 to 1013
L luminosity range.
For the purpose of the present analysis we reexamined the radio-IR correlation starting from the same galaxy sample used by CAH91, the revised IRAS Bright Galaxy Sample, elimating galaxies that were not detected in all 4 IRAS bands, and removing AGN using a more recent catalog of spectroscopically confirmed AGN galaxies (Véron-Cetty & Veron 2001, catalog of Quasars and AGN). The total number of galaxies left in the sample is 222, compared to 258 galaxies used in the analysis of CAH91. We used the additional 12 and 25 µm IRAS bands to derive the total 8-1000 µm IR luminosity from the relation (Sanders & Mirabel 1996):
 |
(3) |
Figure 1 depicts the radio-IR correlation for a
{P-LIR}
presentation of the data, and the best power-law fit to the data.
We derive an almost identical slope
for the same sample of galaxies as CAH91, with
a smaller value for ,
reflecting the fact that the 8 - 40 µm emission was not
included in their galactic IR energy budget. The values of the fit for
radio-IR correlation are: {,
} = {2.96
× 1010,
1.083 ± 0.02}. An almost identical slope was obtained for the
{S-FIR}
presentation, suggesting that there were no significant flux related
systematic errors in determining the distances of the galaxies in the
sample. Also shown in Figure 1 is a forced linear fit to the data with
{,
} = {2.47
× 1011, 1.0}. The linear fit is almost indistinguishable
from the best fit for galaxies with luminosities above ~
1010 L,
which produce most of the IR luminosity density in
the local and high-z universe. The same linear fit will provide a
similarly good representation of the radio-IR correlation even if the
AGN were included in the data. The AGN population however shows more
dispersion around the fit.
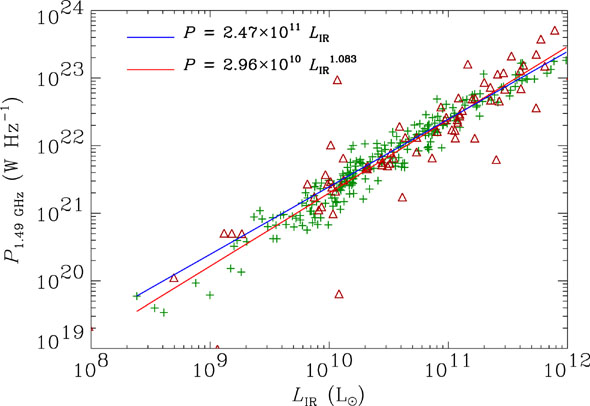 |
Figure 1. The radio fluxes of galaxies in the IRAS BGS are plotted versus their 8-1000 µm luminosity determined from eq. (3). Star-forming galaxies are represented by crosses, and spectroscopically confirmed AGN by open triangles. The lines are fits to the radio-IR correlation between the star-forming galaxies only. The solid blue line represents the best power-law fit, and the red line the best linear fit to the data. The population of AGN generally follows the same correlation, but with a wider dispersion. |