


Several models have been recently developed for calculating the
evolution of
 IR(z)
with redshift. Here we will focus on some select representative cases:
Malkan & Stecker
(2001, baseline model),
Chary & Elbaz (2001,
pure luminosity evolution model), and
Xu et al. (2001,
peak model). These models were developed to explain the limits and
detections of the CIB spectrum and galaxy number counts obtained with
the IRAS, the Infrared Space Observatory (ISO), and
the Submillimeter Common User Bolometric Array (SCUBA) instrument on the
James Clerk Maxwell Telescope (JCMT) at various IR and submillimeter
wavelengths.
Figure 2 presents the evolution of
IR(z) for
these select models. Also plotted are observational estimates of the
comoving cosmic star formation rate (CSFR) at different redshifts. Star
formation rates were converted to IR luminosity densities using the
relation
(Kennicutt 1998):
IR(L
IR(z)
with redshift. Here we will focus on some select representative cases:
Malkan & Stecker
(2001, baseline model),
Chary & Elbaz (2001,
pure luminosity evolution model), and
Xu et al. (2001,
peak model). These models were developed to explain the limits and
detections of the CIB spectrum and galaxy number counts obtained with
the IRAS, the Infrared Space Observatory (ISO), and
the Submillimeter Common User Bolometric Array (SCUBA) instrument on the
James Clerk Maxwell Telescope (JCMT) at various IR and submillimeter
wavelengths.
Figure 2 presents the evolution of
IR(z) for
these select models. Also plotted are observational estimates of the
comoving cosmic star formation rate (CSFR) at different redshifts. Star
formation rates were converted to IR luminosity densities using the
relation
(Kennicutt 1998):
IR(L Mpc-3) =
6 × 10⁹ ×
Mpc-3) =
6 × 10⁹ ×  *(M
yr-1 Mpc-3). References to the CSFR data can
be found in the papers listed above. Also shown in the figure are
approximate upper and lower limits to the IR luminosity density. The
top-hat function centered on redshift z = 1 in the
figure represents the instantaneous energy injection model used by
Haarsma & Partridge
(1998)
to calculate the CRB. The amplitude of the function was chosen so that
it reproduced the nominal ~ 5-1000 µm CIB intensity of 50
nW m-2 sr-1
(Hauser & Dwek 2001).
*(M
yr-1 Mpc-3). References to the CSFR data can
be found in the papers listed above. Also shown in the figure are
approximate upper and lower limits to the IR luminosity density. The
top-hat function centered on redshift z = 1 in the
figure represents the instantaneous energy injection model used by
Haarsma & Partridge
(1998)
to calculate the CRB. The amplitude of the function was chosen so that
it reproduced the nominal ~ 5-1000 µm CIB intensity of 50
nW m-2 sr-1
(Hauser & Dwek 2001).
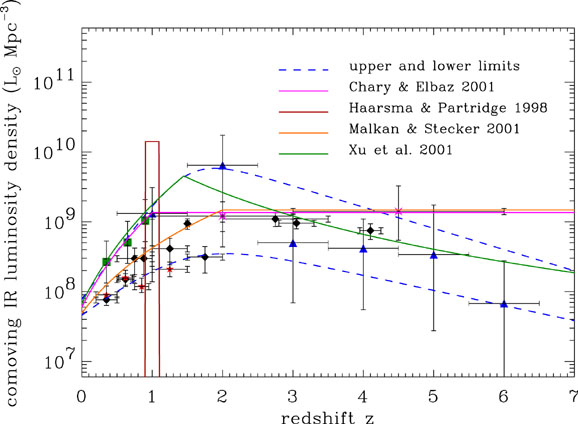 |
Figure 2. The comoving IR luminosity
density predicted by several galaxy number count models as a function
of redshift. The data points represent optical and IR determinations of
the comoving cosmic star formation rate as a function of redshift
(references to the data can be found in the papers listed above). A
scaling factor of 6 × 10⁹ was used to convert the CSFR
(in M |
Figure 3 shows the value of
g( ) as a function
of for the different
star formation histories depicted in Figure 2.
The function g() is
insensitive to the cosmic star formation history, a direct consequence
of the fact that the integrands in eq. (13) differ only by a factor of
(1 +
z)-1.
For
) as a function
of for the different
star formation histories depicted in Figure 2.
The function g() is
insensitive to the cosmic star formation history, a direct consequence
of the fact that the integrands in eq. (13) differ only by a factor of
(1 +
z)-1.
For
 0.6-1.2, the most
probable range of values for the radio spectral index,
g() is well
approximated by:
0.6-1.2, the most
probable range of values for the radio spectral index,
g() is well
approximated by:
 |
(14) |
to an accuracy better than 2%.
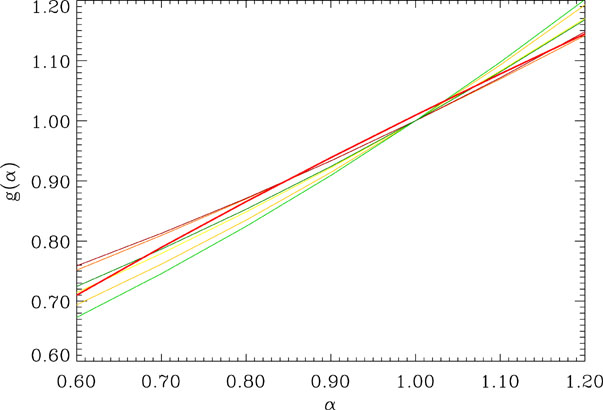 |
Figure 3. The function
g( |
Using eqs. (12), (14) and the linear radio-IR correlation at
 0 = 1.49 GHz:
P(W
Hz-1) = 2.47 × 10¹¹
LIR(L), we can express the CIB intensity in terms of the
radio brightness temperature at frequency
R = 178 MHz as:
0 = 1.49 GHz:
P(W
Hz-1) = 2.47 × 10¹¹
LIR(L), we can express the CIB intensity in terms of the
radio brightness temperature at frequency
R = 178 MHz as:
 |
(15) |
Table 1 lists the values of the CIB intensity and
the 178 MHz brightness temperature obtained from the respective use of
eqs. (10) and (11) for the different star formation histories and radio
spectral index
. The entries in the
table satisfy the analytical approximation for the relation between
ICIB, Tcrb, and
to an accuracy of a few
percent. For comparison we also listed the observed limits and
detections of the CIB
(Hauser & Dwek 2001)
and the 178 MHz CRB brightness temperature inferred from the Bridle data
(Bridle 1967)
for the different values of
. Also shown in the
table are the observed Tcrb/ICIB
ratios and those predicted by the CIB-CRB correlation [eq. (15)].
| Model | ICIB(nW m-2 sr-1) | Tcrb(K) at 178 MHz | ||||
| (3.5-1000 µm) | = 0.6 |
= 0.7 |
= 0.8 |
= 0.9 |
||
| minimum CSFR | 8.5 | 2.7 | 3.1 | 3.5 | 4.1 | |
| maximum CSFR | 73 | 24.8 | 28.0 | 31.5 | 35.6 | |
| Haarsma & Partridge (1998) | 50 | 15.7 | 18.1 | 20.8 | 24.1 | |
| Malkan & Stecker (2001) | 23 | 8.2 | 9.1 | 10.2 | 11.4 | |
| Chary & Elbaz (2001) | 37 | 12.3 | 13.9 | 15.8 | 18.0 | |
| Xu et al. (2001) | 58 | 18.8 | 21.5 | 24.5 | 27.9 | |
| Observational Limits b | 50±25 | 57±11 | 37±8 | 23±5 | 15±3 | |
 -1 -1
 Tcrb /
ICIB (calculated)c Tcrb /
ICIB (calculated)c |
0.33 | 0.37 | 0.42 | 0.48 | ||
| Tcrb / ICIB (observed) | 1.1±0.6 | 0.7±0.4 | 0.5±0.25 | 0.30±0.16 | ||
a The CSFR predicted by the
tabulated models are shown in Figure 2. CIB
intensities and CRB temperatures were calculated from eqs. (10)
and (11), respectively. The parameter
|
||||||
b Observational limits on the CIB intensity are summarized in Hauser & Dwek (2001). CRB temperatures were taken from Bridle (1967, Table VIII). |
||||||
c Calculated using eq. (15). |
||||||
It is interesting to compare our model predictions with the result
obtained by
Haarsma & Partridge
(1998).
HP98 found that the star-forming galaxies that produce the detected
120-260 µm CIB intensity of ~ 22 nW m-2
sr-1 contribute about 15 K to the 178 MHz brightness
temperature (they adopted a value of
= 0.7). This result
seems at first glance to be in
disagreement with the entry for the HP98 model in the table. The reason
for this apparent "discrepancy" is that HP98 expressed the radio-IR
correlation in terms of the FIR luminosity of galaxies. Had they
expressed this correlation in terms of their IR luminosity, which is
about twice the FIR value, they would have derived a radio brightness
temperature of ~ 17 K for a 3.5-1000 µm background
intensity of 50 nW m-2 sr-1, almost identical to
the value listed in the table. The analytical expression presented in
this paper reproduces the results derived by HP98 for their specific CIB
production scenario, and generalizes their treatment to any cosmic star
formation history.