Copyright © 1997 by Annual Reviews. All rights reserved
| Annu. Rev. Astron. Astrophys. 1997. 35:
309-355 Copyright © 1997 by Annual Reviews. All rights reserved |


2.2. Light Curves
Some representative optical light curves of SNe are shown by Minkowski (1964); much more complete atlases of SNe I and SNe II are given by Leibundgut et al (1991c), Patat et al (1993), respectively. The most obvious conclusion is that to first order, the light curves of SNe I are all broadly similar, whereas those of SNe II exhibit much dispersion.
Despite their bewildering variety, the majority of early-time light
curves of SNe II (t
 100 days) can be
usefully subdivided into two relatively distinct subclasses
(Barbon et al
1979,
Doggett & Branch
1985).
The light curves of SNe II-L ("linear") generally resemble those of SNe
I, whereas SNe II-P ("plateau") remain within ~ 1 mag of maximum
brightness for an extended period (Figure 3).
The degree to which there is a continuity between SNe II-L and SNe II-P is
still debated, and other possible classification schemes are being
considered
(Patat et al 1994).
The plateau of SN 1992H, for example, was somewhat shorter than
usual and declined with time in the VRI passbands, and it was barely
visible or nonexistent in B and U, leading
Clocchiatti et al
(1996a) to call this a hybrid object.
100 days) can be
usefully subdivided into two relatively distinct subclasses
(Barbon et al
1979,
Doggett & Branch
1985).
The light curves of SNe II-L ("linear") generally resemble those of SNe
I, whereas SNe II-P ("plateau") remain within ~ 1 mag of maximum
brightness for an extended period (Figure 3).
The degree to which there is a continuity between SNe II-L and SNe II-P is
still debated, and other possible classification schemes are being
considered
(Patat et al 1994).
The plateau of SN 1992H, for example, was somewhat shorter than
usual and declined with time in the VRI passbands, and it was barely
visible or nonexistent in B and U, leading
Clocchiatti et al
(1996a) to call this a hybrid object.
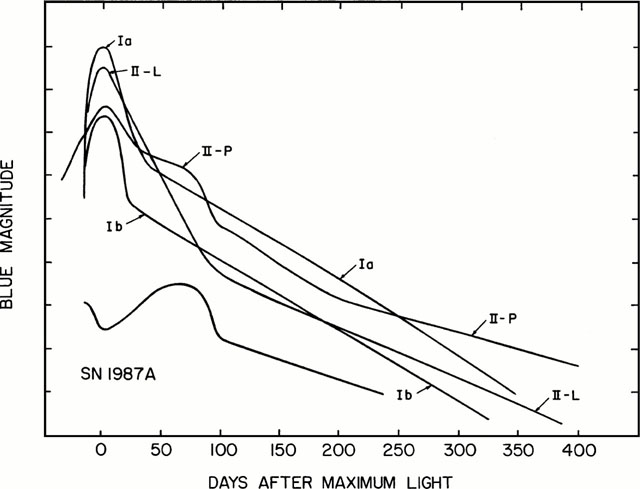 |
Figure 3. Schematic light curves for SNe of Types Ia, Ib, II-L, II-P, and SN 1987A. The curve for SNe Ib includes SNe Ic as well, and represents an average. For SNe II-L, SNe 1979C and 1980K are used, but these might be unusually luminous. From Wheeler 1990; reproduced with permission. |
The peak absolute magnitudes of SNe II-P show a very wide dispersion
(Schmitz &
Gaskell 1988,
Young & Branch
1989),
almost certainly due to differences in the radii of the progenitor stars.
Most SNe II-L, on the other hand, have a nearly uniform peak absolute
magnitude
(Young & Branch
1989,
Gaskell 1992),
~ 2.5
mag fainter than SNe Ia, although a few exceptionally luminous SNe II-L
(SN 1979C, and to a lesser extent SN 1980K) are
known. At late times
(t  150
days), the light curves of most SNe II resemble each other, both in
shape and absolute flux
(Turatto et al
1990,
Patat et al
1994).
The decline rate is close to that expected from the decay of
Co56 to Fe56 (0.98 mag/100 days), especially in V.
150
days), the light curves of most SNe II resemble each other, both in
shape and absolute flux
(Turatto et al
1990,
Patat et al
1994).
The decline rate is close to that expected from the decay of
Co56 to Fe56 (0.98 mag/100 days), especially in V.
The light curve of SN 1987A (Figure 3), although unusual, was generically related to those of SNe II-P; the initial peak was low because the progenitor was a blue supergiant, much smaller than a red supergiant (Arnett et al 1989 and references therein). Additional objects of a possibly similar nature are SN 1909A (Young & Branch 1988) and SNe 1923A, 1948B, and 1965L (Schmitz & Gaskell 1988). Some SNe II decline very slowly at early times (Section 5.4), probably because of energy radiated during the interaction of the ejecta with circumstellar gas (e.g. SN 1987F, Chugai 1991; SN 1988Z, Turatto et al 1993b, Chugai & Danziger 1994); they do not fit into the two main photometric subclasses. Indeed, they appear to constitute a subclass that is also spectroscopically distinct (SN IIn; Section 5.4).
Barbon et al (1973, their Figure 1) illustrate the B-band light curves of 38 SNe I on a single plot, after having adjusted them in both coordinates to minimize the dispersion. There is considerable scatter, some of which is due to intrinsic differences among SNe Ia (Section 3.3). Moreover, three SNe now known to have been SNe Ib (1962L, 1964L, 1966J), as well as some number of unrecognized SNe Ib/Ic, were included in this compilation, yet their light curves are not identical to those of SNe Ia. (Note that the archaic "SNe Ia" and "SNe Ib" of Barbon et al, defined according to photometric properties, should not be confused with the modern, spectroscopic designations.) SNe Ic 1987M and 1994I, for example, declined markedly faster than SNe Ia (Filippenko et al 1990, Richmond et al 1996b), whereas the decline rate of the few SNe Ib that have been studied appears to be slower than that of SNe Ia (Schlegel & Kirshner 1989, Kirshner 1990). Clocchiatti & Wheeler (1997) recently found that the light curves of SNe Ic cluster into two different categories: Some fall more slowly than SNe Ia (like SNe Ib), and others more rapidly, even though they have nearly identical spectra. This serves as an important reminder that light curves can provide physical diagnostics not available from spectra alone.
It is appropriate at this point to mention
Zwicky's (1965)
SN Types III, IV, and V, all of which had peculiar light curves. Each of
these classes has only a few known examples, and in all cases their spectra
showed hydrogen. As stated by
Oke & Searle
(1974),
Doggett & Branch
(1985),
they should therefore be considered as SNe II (or peculiar SNe II), at least
until additional objects that have similar characteristics are found and
examined in detail. SN 1961V in NGC 1058 (Type V) had the most bizarre light
curve ever recorded. The less luminous SN 1954J, also known as Variable 12
in NGC 2403, had a light curve shape similar to that of SN 1961V; see
Humphreys &
Davidson (1994).
SNe V may not even be genuine SNe, a conclusion reached by
Goodrich et al
(1989),
Filippenko et al
(1995a)
for the specific case of SN 1961V; rather, they may be super-outbursts
of luminous blue variables such as
 Carinae.