Copyright © 1997 by Annual Reviews. All rights reserved
| Annu. Rev. Astron. Astrophys. 1997. 35:
309-355 Copyright © 1997 by Annual Reviews. All rights reserved |


3.3. Heterogeneity
Nevertheless, careful inspection of high-quality data demonstrates that differences among SNe Ia do indeed exist. In Figure 6, for example, the depths of the features near 5750 Å and 8050 Å differ. Moreover, the ejecta of SNe Ia do not always have the same velocity at a given phase (Branch 1987, Branch et al 1988; see also Figures 5 and 6). Remarkably, the smallest ejection velocities are generally found among SNe Ia in elliptical galaxies (Filippenko 1989b, Branch & van den Bergh 1993). A spectroscopic distinction between SNe Ia in spiral and elliptical galaxies clearly indicates that there are real physical differences among SNe Ia; the dissimilar ejection velocities cannot be a consequence of viewing an asymmetric explosion from different angles. Also, after many tenuous suggestions (e.g. Barbon et al 1973, Rust 1974, Pskovskii 1977, 1984, Branch 1981), variations in the light curve shapes among SNe Ia have finally been confirmed beyond doubt and shown to be correlated with luminosity: Intrinsically bright SNe Ia rise and decline more slowly than dim ones (Phillips 1993, Hamuy et al 1995, 1996a, Riess et al 1995a, 1996). The most luminous SNe Ia seem to occur in young stellar populations (Hamuy et al 1995, Branch et al 1996), which is an important result.
Spectroscopic and photometric peculiarities have been noted with increasing frequency in well-observed SNe Ia during the past decade. One of the best examples is SN 1986G: Phillips et al (1987), Cristiani et al (1992) observed anomalies in the optical spectra as well as a rapid postmaximum decline in the UBV bands, Frogel et al (1987) reported clearly discrepant IR (JHK) light curves, and the early-time UV spectrum was unusual (Panagia & Gilmozzi 1991). Another interesting object, SN 1990N (Leibundgut et al 1991a, Phillips et al 1992, Mazzali et al 1993), had significantly weaker Si II absorption (at 6150 Å) at t = -1 week than did the normal SNe Ia 1989B and 1994D (Figure 7), but its postmaximum evolution was typical. A striking case is SN 1991T; its premaximum spectrum did not exhibit Si II or Ca II absorption lines at all (Figure 7), yet two months past maximum the spectrum was nearly indistinguishable from that of a classical SN Ia (Filippenko et al 1992b, Ruiz-Lapuente et al 1992, Phillips et al 1992, Jeffery et al 1992, Mazzali et al 1995). Superior photometry reported by Phillips et al (1992) shows that the light curves of SN 1991T were slightly broader than the SN Ia template curves, and the object was probably somewhat more luminous than average at maximum (Filippenko et al 1992b, Phillips 1993, Riess et al 1996). Spectroscopically similar objects were subsequently identified by Filippenko & Leonard (1995; SN 1995ac) and by Garnavich et al (1995b; SN 1995bd).
 |
Figure 7. Spectra of SNe Ia about one week before maximum brightness. The parent galaxies and their redshifts (kilometers per second) are as follows: SN 1994D (NGC 4526; 850), SN 1990N (NGC 4639; 970), and SN 1991T (NGC 4527; 1740). |
SN 1991bg, in the E1 galaxy NGC 4374, is the
reigning champion of well-observed peculiar SNe Ia
(Filippenko et al
1992a,
Leibundgut et al
1993,
Turatto et al
1996,
Mazzali et al 1997).
At maximum brightness, SN 1991bg was subluminous by 1.6 mag in V and 2.5
mag in B, compared with normal SNe Ia. The colors were unusually red at
maximum,
but the object was not significantly reddened by dust; indeed, at late times
the object may have been slightly bluer than normal SNe Ia
(Leibundgut et al
1993).
The decline from maximum was certainly quite steep;
Filippenko et al
(1992a)
measured an initial linear V fading of 0.10 mag day-1, rather
than the typical value of 0.06 mag day-1 for SNe Ia, and a
late-time decline of 0.034 mag day-1, rather than 0.026 mag
day-1. Also, the "knee" in the V light curve of SN 1991bg
occurred only ~ 20 days past maximum, in contrast to the usual value of
~ 35 days. Unlike the case in normal SNe Ia, the I-band light curve did
not exhibit
a secondary maximum, and the R-band light curve showed no sign of a plateau.
Furthermore, the spectrum of SN 1991bg at maximum had a deep trough around
4200 Å produced by Ti II
(Filippenko et al
1992a);
lines of Ti II and other intermediate-mass elements were present elsewhere
in the spectrum as well, whereas Fe II was weak or absent. The expansion
velocity (~ 10,000 km s-1) was slightly lower than average
(11,000-13,000 km s-1)
for luminous SNe Ia. A spectrum obtained three weeks past maximum showed
a relatively narrow absorption line attributed to Na I D, as well as the
emergence of forbidden emission lines; apparently the nebular phase began
very early in SN 1991bg. Three months past maximum the [Ca II]
 7291, 7324 blend began
dominating the spectrum.
7291, 7324 blend began
dominating the spectrum.
Although "normal" SNe Ia (defined by objects such as SNe 1937C, 1972E,
1981B, 1989B, and 1994D) constitute a majority
( 80%) of SNe Ia
observed thus far
(Branch et al 1993),
very subluminous and peculiar SNe Ia like SN 1991bg might be intrinsically
as common per unit volume but are more difficult to find (e.g.
Schaefer 1996).
The second known example is SN 1992K
(Hamuy et al 1994),
whose luminosity, spectral characteristics, light curves, and color curves
were nearly identical to those of SN 1991bg. Note that the host galaxy of
SN 1992K is a spiral, whereas that of SN 1991bg is an elliptical, though
SN 1992K may have been associated with the older
bulge population. Yet another probable member of this subclass is SN 1991F in the lenticular galaxy
NGC 3458
(Gómez
& López 1995):
Its late-time spectrum closely resembled that of SN 1991bg, but its
photometric properties are unknown. In all cases where the requisite
data have been obtained, the subluminous objects are intrinsically red
compared with most normal SNe Ia
(Hamuy et al
1995,
Vaughan et al 1995).
80%) of SNe Ia
observed thus far
(Branch et al 1993),
very subluminous and peculiar SNe Ia like SN 1991bg might be intrinsically
as common per unit volume but are more difficult to find (e.g.
Schaefer 1996).
The second known example is SN 1992K
(Hamuy et al 1994),
whose luminosity, spectral characteristics, light curves, and color curves
were nearly identical to those of SN 1991bg. Note that the host galaxy of
SN 1992K is a spiral, whereas that of SN 1991bg is an elliptical, though
SN 1992K may have been associated with the older
bulge population. Yet another probable member of this subclass is SN 1991F in the lenticular galaxy
NGC 3458
(Gómez
& López 1995):
Its late-time spectrum closely resembled that of SN 1991bg, but its
photometric properties are unknown. In all cases where the requisite
data have been obtained, the subluminous objects are intrinsically red
compared with most normal SNe Ia
(Hamuy et al
1995,
Vaughan et al 1995).
Maza et al (1994) present a striking example of the photometric heterogeneity of SNe Ia. As part of the Calán/Tololo search for SNe, they discovered two SNe Ia at redshift z = 0.02, presumably at nearly the same distance because the peculiar velocities of their host galaxies are likely to be small relative to the Hubble flow. SN 1992bc was 0.69-mag brighter than SN 1992bo in B; in addition, its light curves declined more slowly than those of SN 1992bo, and in fact closely resembled those of the overluminous SN 1991T (Phillips et al 1992, Phillips 1993). Differences in the shapes of high-quality CCD light curves of numerous SNe Ia are illustrated by Riess (1996), Hamuy et al (1996c).
The photometric heterogeneity among extreme examples of SNe Ia is perhaps best demonstrated by Suntzeff (1996) with five objects that have excellent BVRI light curves, all scaled to the same maximum brightness (Figure 8). The differences in decline rates at early times are largest in B, followed by V; they are relatively minor at R and I, except for those of SN 1991bg. At late times, however, the R and I light curves exhibit more scatter than the B and V curves. Two months past maximum, for example, SN 1991T and SN 1991bg differ by 1.3 mag in R (but very little in B) after normalizing to the same peak. Suntzeff (1996) goes on to show the difference in bolometric (near-UV through near-IR) luminosity of four SNe Ia as a function of time. At maximum brightness, SN 1991T was a factor of 5 more luminous than SN 1991bg, and this grew to a factor of 9 by one month past maximum.
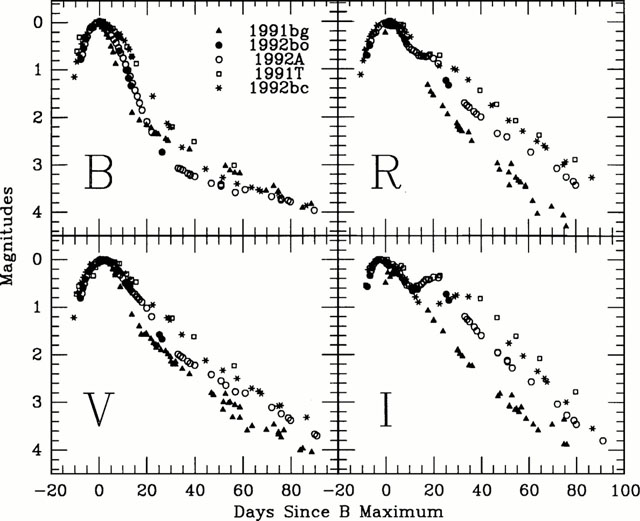 |
Figure 8. BV (left panels) and RI (right panels) evolution of bright SNe Ia. From Suntzeff (1996); reproduced with permission. |