Copyright © 1997 by Annual Reviews. All rights reserved
| Annu. Rev. Astron. Astrophys. 1997. 35:
309-355 Copyright © 1997 by Annual Reviews. All rights reserved |


The first thorough long-term set of spectra of a SN Ia was that of SN 1937C, obtained photographically by Minkowski (1939), with an intensity calibration provided by Greenstein & Minkowski (1973). The use of linear detectors having high quantum efficiency (especially CCDs) led to the publication of better sequences of spectra of "normal SNe Ia" (Section 3.3), specifically those of SN 1972E (Kirshner et al 1973, Kirshner & Oke 1975), SN 1981B (Branch et al 1983), SN 1989B (Barbon et al 1990, Wells et al 1994), and SN 1994D (Meikle et al 1996, Patat et al 1996, Filippenko 1997a). Wells et al (1994) discuss in some detail the temporal changes in their densely sampled spectra of SN 1989B. A representative set of spectra of SN 1994D is illustrated in Figure 4.
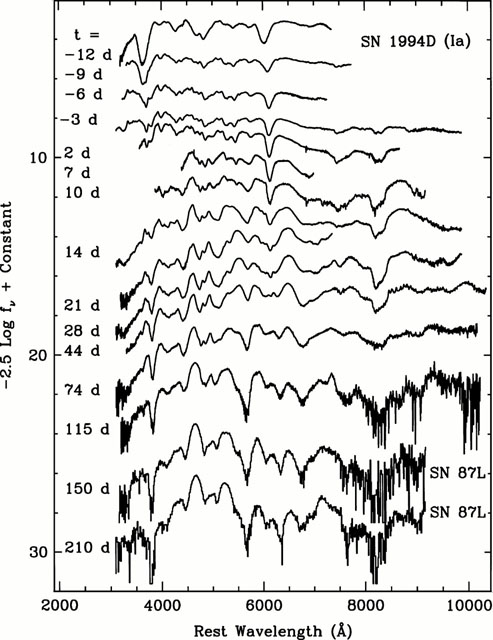 |
Figure 4. Montage of spectra of SN Ia 1994D in NGC 4526 (cz = 850 km s-1), based on data from Patat et al (1996; reproduced with permission) and Filippenko (1997a). Epochs (days) are given relative to maximum B brightness (March 20.5, 1994). The last two spectra are of the similar SN Ia 1987L in . |
The early-time spectra of SNe Ia exhibit
prominent broad peaks and valleys. Extensive computer modeling of the
expanding
ejecta has resulted in reliable identifications for most features, after
decades of uncertainty. In general, at very early times they are attributed
to lines of neutral and singly ionized intermediate-mass elements (O, Mg,
Si, S, Ca), with some contribution from iron-peak elements (Fe, Co)
especially at near-UV wavelengths
(Branch et al
1983,
1985,
Harkness 1986,
1991,
Kirshner et al
1993,
Mazzali et al
1993).
The strongest features are Si II
 6355 and Ca II H&K
3934, 3968. Convincing
evidence for the presence of helium has never been shown, although the
results of Meikle et
al (1996) are intriguing and warrant further scrutiny.
6355 and Ca II H&K
3934, 3968. Convincing
evidence for the presence of helium has never been shown, although the
results of Meikle et
al (1996) are intriguing and warrant further scrutiny.
The relative contribution of iron-group elements quickly increases as
the photosphere recedes into the ejecta. By t
 2 weeks the spectrum
is dominated by lines of Fe II, which is consistent with an iron-rich
core
(Harkness 1991),
but some lines of intermediate-mass elements are still present (e.g. Si II,
Ca II). Thereafter the spectral changes are more gradual, although forbidden
emission lines of Fe (and some Co, most prominent at ~ 5900 Å)
eventually dominate in the nebular phase
(Axelrod 1980),
which begins roughly one month past maximum brightness. Nevertheless, Ca
II remains visible, primarily in absorption (Ca II H&K and the near-IR
triplet of
8498, 8542, 8662).
Qualitatively,
Axelrod (1980)
was able to show that the cobalt lines decrease with time in a manner
suggestive
of radioactive decay. More recently, compelling evidence that the late-time
tail of SNe Ia is powered by the decay of radioactive Co56
(initially from radioactive Ni56) was found from the temporal
changes in the intensity ratio of two relatively unblended [Co III] and
[Fe III] emission lines
(Kuchner et al
1994; see also
Varani et al
1990
for the case of SN 1987A). Also,
Spyromilio et al
(1992)
demonstrated the presence of a large amount (0.4-0.7
M
2 weeks the spectrum
is dominated by lines of Fe II, which is consistent with an iron-rich
core
(Harkness 1991),
but some lines of intermediate-mass elements are still present (e.g. Si II,
Ca II). Thereafter the spectral changes are more gradual, although forbidden
emission lines of Fe (and some Co, most prominent at ~ 5900 Å)
eventually dominate in the nebular phase
(Axelrod 1980),
which begins roughly one month past maximum brightness. Nevertheless, Ca
II remains visible, primarily in absorption (Ca II H&K and the near-IR
triplet of
8498, 8542, 8662).
Qualitatively,
Axelrod (1980)
was able to show that the cobalt lines decrease with time in a manner
suggestive
of radioactive decay. More recently, compelling evidence that the late-time
tail of SNe Ia is powered by the decay of radioactive Co56
(initially from radioactive Ni56) was found from the temporal
changes in the intensity ratio of two relatively unblended [Co III] and
[Fe III] emission lines
(Kuchner et al
1994; see also
Varani et al
1990
for the case of SN 1987A). Also,
Spyromilio et al
(1992)
demonstrated the presence of a large amount (0.4-0.7
M ) of
iron in the ejecta of SN 1991T. Incidentally, SN 1991T is the only SN Ia
to have been observed spectroscopically more than two years past maximum,
but the data were dominated by an echo produced by foreground dust
reflecting the near-maximum spectrum
(Schmidt et al
1994c).
) of
iron in the ejecta of SN 1991T. Incidentally, SN 1991T is the only SN Ia
to have been observed spectroscopically more than two years past maximum,
but the data were dominated by an echo produced by foreground dust
reflecting the near-maximum spectrum
(Schmidt et al
1994c).
Early-time photospheric expansion velocities, determined
by measuring the positions of Doppler-shifted absorption minima in the P
Cygni profiles of strong, fairly unblended lines such as Si
II 6355, are typically
 10,000 km
s-1
(Pskovskii 1977,
Branch 1981).
Different lines do not have identical velocities: for example, Si II
(10,000-12,000 km s-1) and Ca II H&K (13,000-15,000 km
s-1)
at maximum brightness. Initially the velocity obtained from the Si II and
Ca II H&K lines decreases rapidly with time, as shown most recently by
Wells et al
(1994),
Patat et al
(1996);
see Figure 5.
Patat et al
(1996)
note that there is a sudden break in the decline rate around t =
-6 days, most easily visible in the Si II line
(Figure 5).
10,000 km
s-1
(Pskovskii 1977,
Branch 1981).
Different lines do not have identical velocities: for example, Si II
(10,000-12,000 km s-1) and Ca II H&K (13,000-15,000 km
s-1)
at maximum brightness. Initially the velocity obtained from the Si II and
Ca II H&K lines decreases rapidly with time, as shown most recently by
Wells et al
(1994),
Patat et al
(1996);
see Figure 5.
Patat et al
(1996)
note that there is a sudden break in the decline rate around t =
-6 days, most easily visible in the Si II line
(Figure 5).
 |
Figure 5. Evolution of the expansion
velocity as deduced from the minima of the Si II
|
Note that the broad emission near 6500 Å, which begins to develop
around t = 2 weeks and remains thereafter with some changes in
shape (Figure 4), is not
H but rather Fe II and
later [Fe II]. It is occasionally incorrectly identified as
H by observers
attempting to classify spectra of SN candidates. Similarly, the strong
Si II
6355 line at early
times is sometimes attributed to
H.
In both cases, erroneous classifications of Type II are made, especially
when uncalibrated spectra are quickly examined at the time of observation.
but rather Fe II and
later [Fe II]. It is occasionally incorrectly identified as
H by observers
attempting to classify spectra of SN candidates. Similarly, the strong
Si II
6355 line at early
times is sometimes attributed to
H.
In both cases, erroneous classifications of Type II are made, especially
when uncalibrated spectra are quickly examined at the time of observation.