


4.4. IRAS Colors
A full discussion of the IRAS colors for this sample is beyond the scope of this paper. However, it is worth pointing out here that the primary statistical trends reported previously in BGS1 (Soifer et al. 1989) have not changed substantially when using the more accurate RBGS fluxes. We discuss the IRAS colors of the RBGS objects briefly below.
Figure 7 shows the distributions of the RBGS IRAS flux density ratios observed in individual sources. The largest range is found for the ratios 12 µm / 25 µm and 12 µm / 60 µm (~ 1.5dex), while the ratios 60 µm / 100 µm and 25 µm / 60 µm cover a narrower range (~ 0.8dex).
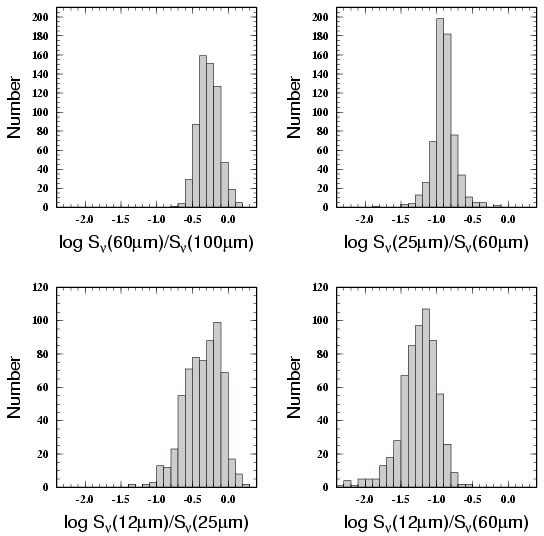 |
Figure 7. Distributions of total
IRAS flux density ratios:
(a) S |
All of the galaxies in the RBGS exhibit SEDs whose infrared emission increases between 25 µm and 60 µm with the bulk of the sample having S60 / S25 in the range ~ 5 - 15. This simply reflects the dominance of thermal emission from relatively "cool" dust (i.e. Tdust ~ 25 - 70 K) in the infrared SEDs of the 60 µm selected IRAS bright galaxies. This range of dust temperature is also consistent with the range of observed S100 / S60 ratios (~ 4 - 0.5). Several authors have now shown that this latter ratio is correlated with infrared bolometric luminosity, with the most luminous IRAS sources having the largest values of S60 / S100 (see Sanders & Mirabel 1996 for references).
Not all of the observed IRAS flux ratios can be simply understood in terms of a single dust temperature component. For example, the relatively flat distribution found for S25 / S60 versus S60 / S100 (Figure 8, top panel) likely reflects the combined effects of more than one prominent dust temperature component. Although most galaxies have a dominant "cool" dust component as discussed above, a significant fraction also show a secondary "warm" dust component that typically peaks near 25 µm - that appears to be associated with the presence of Seyfert/AGN activity (e.g. Miley et al. 1984; deGrijp et al. 1985).
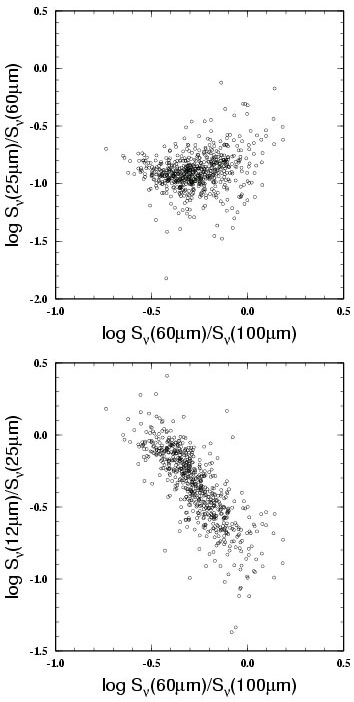 |
Figure 8. IRAS flux density ratio correlations using the revised total flux estimates in Table 1. |
One of the more surprising results concerning the IRAS colors of galaxies in the RBGS is seen in the inverse correlation between the 60 µm / 100 µm ratio and the 12 µm / 25 µm (Figure 8, bottom panel). Soifer & Neugebauer (1991) previously showed that this ratio was also strongly correlated with galaxy infrared luminosity (see their Figs. 5 and 6). One plausible "simple" interpretation that has been proposed is that the component of "hot" (T ~ 100 - 200K) dust found in the SEDs of most "normal" spiral disks decreases due to the increasing destruction rate of small grains as the intensity of the nuclear radiation field increases with increasing total galaxy infrared luminosity.
 (12µm) /
S
(12µm) /
S