


4.5. Luminosity Function
An appropriate quantity for comparing the RBGS galaxies with other classes
of extragalactic objects selected at other wavelengths is
the infrared luminosity,
Lir(8 - 1000µm), computed using all
four IRAS bands
(Soifer et al. 1987;
Sanders & Mirabel 1996).
Soifer et al. (1987)
first used the "infrared bolometric luminosity" to compare IRAS BGS
galaxies with the total bolometric luminosity for several optically
selected galaxy samples (Seyferts, starbursts, QSOs, etc).
Here we reconstruct the infrared bolometric
luminosity function using the new IRAS measurements listed in
Table 1 for the RBGS
galaxies. All of the RBGS objects have measured redshifts, and all have
measured flux densities in all four IRAS bands (except for a very
small percentage of objects with upper limits at 12 µm).
The space density of the galaxies,
 , is the number
of objects per cubic megaparsec per unit absolute magnitude interval.
The units of
are Mpc-3 Mir-1, where
Mir signifies infrared absolute magnitude bins computed
using logarithmic intervals in which
each luminosity bin boundary is a factor of 100.4 larger than
the previous one
12 .
, is the number
of objects per cubic megaparsec per unit absolute magnitude interval.
The units of
are Mpc-3 Mir-1, where
Mir signifies infrared absolute magnitude bins computed
using logarithmic intervals in which
each luminosity bin boundary is a factor of 100.4 larger than
the previous one
12 .
Figure 9 plots the distribution of heliocentric radial velocities (c * z) for the complete RBGS using the redshifts tabulated in Table 1 taken from the references given in Table 7. The sharp peak in the 1000-2000 km s-1 redshift bin is largely due to the Virgo cluster. Otherwise, the redshift distribution for the RBGS shows a relatively smooth high redshift tail out to a cut-off near cz ~ 26,000 km s-1.
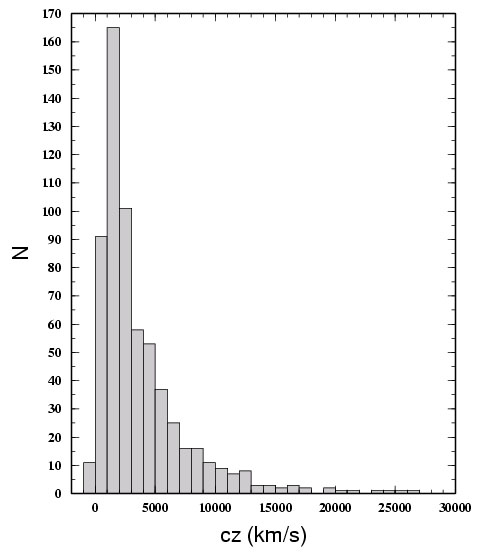 |
Figure 9. Distribution of heliocentric radial velocities (c * z) for the RBGS. |
Distances for the RBGS galaxies have been computed using the new cosmic
attractor flow model outlined in Appendix A of
Mould et al. (2000),
assuming Ho = 75 km s-1 Mpc-1 and
adopting a flat cosmology,
 M = 0.3
and
M = 0.3
and  =
0.7. Figure 10
plots the distribution of distances (Mpc) as tabulated in
Table 1. Again,
the effect of the Virgo cluster can be seen as affecting the strength of
the peak in the 10-20 Mpc bin (assuming our adopted distance to Virgo of 15.3 Mpc).
=
0.7. Figure 10
plots the distribution of distances (Mpc) as tabulated in
Table 1. Again,
the effect of the Virgo cluster can be seen as affecting the strength of
the peak in the 10-20 Mpc bin (assuming our adopted distance to Virgo of 15.3 Mpc).
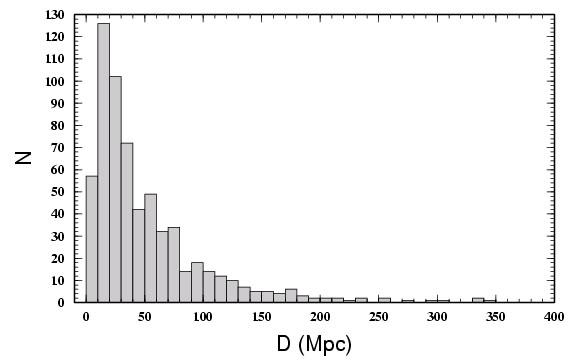 |
Figure 10. Distribution of estimated distances (Mpc) for sources in the RBGS. |
The resulting distribution of infrared luminosities is shown in
Figure 11.
The prescription and references used for computing
Lir are given
in the column notes to Table 1. Except
for a modest excess of objects at
Lir ~ 1010
L (largely due to Virgo) the distribution
shows a relatively broad peak over the luminosity range
log(Lir /
L) ~
9.8 - 11.4 (half-power). The median observed luminosity,
log(Lir /
L) ~
10.65, is somewhat larger than the total
bolometric luminosity of the Milky Way, and the maximum observed
luminosity in the sample, log(Lir /
L) =
12.51 (Mrk 231), is nearly 100 times larger than the median.
(largely due to Virgo) the distribution
shows a relatively broad peak over the luminosity range
log(Lir /
L) ~
9.8 - 11.4 (half-power). The median observed luminosity,
log(Lir /
L) ~
10.65, is somewhat larger than the total
bolometric luminosity of the Milky Way, and the maximum observed
luminosity in the sample, log(Lir /
L) =
12.51 (Mrk 231), is nearly 100 times larger than the median.
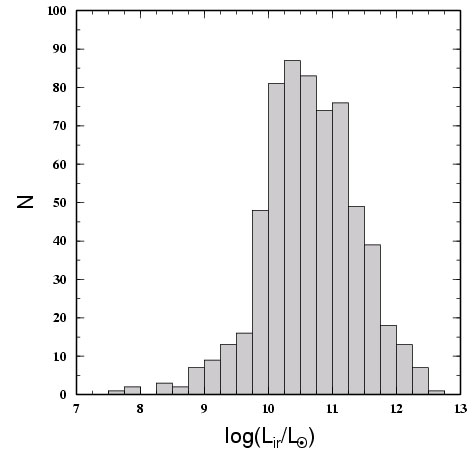 |
Figure 11. Distribution of the base ten logarithm of the total infrared luminosity in Solar units. |
The luminosities plotted in Figure 11 were used
to compute the infrared bolometric luminosity function for the RBGS
(Figure 12), using the
1 / Vmax method
(Schmidt 1968).
The computed values are listed in Table 6.
The "double power-law" shape of the luminosity function for IRAS
bright galaxies is similar to that derived earlier for the BGS1
(e.g.
Soifer et al. 1987),
except for improved statistics at both low and high infrared
luminosities, plus the decreased influence of the Virgo cluster in the
all-sky sample as compared to its effect in the smaller BGS1
survey. The best fit power-laws,
 (L)
(L)
 L
L ,
give = - 0.6(± 0.1)
and = - 2.2
(± 0.1) below and above
Lir ~ 1010.5
L
respectively.
,
give = - 0.6(± 0.1)
and = - 2.2
(± 0.1) below and above
Lir ~ 1010.5
L
respectively.
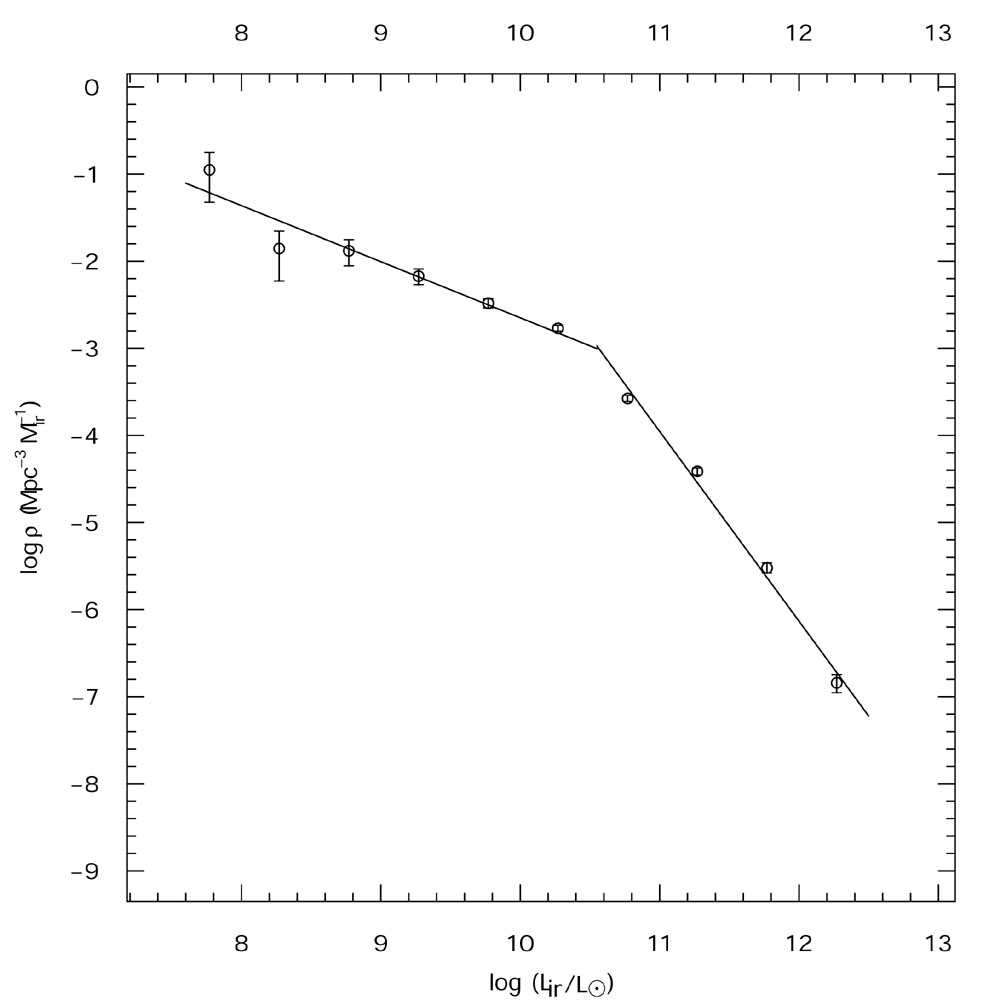 |
Figure 12. The infrared luminosity function
for the RBGS, computed using the 1 / Vmax method.
The space densities and uncertainties plotted are those listed in
Table 6;
the points represent the center of each luminosity bin,
and each bin has a uniform width of 0.5
in units of log(Lir /
L |
| Lir | N | V / Vmax |
(Mpc-3
Mir-1) |
| 7.75 | 3 | 0.16 ± 0.03 | 11.2 ± 6.5 × 10⁻² |
| 8.25 | 3 | 0.28 ± 0.05 | 14.0 ± 8.1 × 10⁻³ |
| 8.75 | 9 | 0.39 ± 0.04 | 13.2 ± 4.3 × 10⁻³ |
| 9.25 | 24 | 0.37 ± 0.02 | 6.7 ± 1.3 × 10⁻³ |
| 9.75 | 69 | 0.56 ± 0.02 | 32.9 ± 4.0 × 10⁻⁴ |
| 10.25 | 168 | 0.44 ± 0.01 | 17.0 ± 1.3 × 10⁻⁴ |
| 10.75 | 157 | 0.45 ± 0.01 | 26.5 ± 2.1 × 10⁻⁵ |
| 11.25 | 122 | 0.53 ± 0.02 | 38.6 ± 3.5 × 10⁻⁶ |
| 11.75 | 56 | 0.50 ± 0.02 | 30.1 ± 4.0 × 10⁻⁷ |
| 12.25 | 18 | 0.44 ± 0.03 | 14.5 ± 3.4 × 10⁻⁸ |
12 This effectively converts intervals
of infrared luminosity (Lir /
L)
to equivalent intervals of absolute magnitude (Mir);
an alternate way to express the units of
is
Mpc-3 [0.4 * log10(Lir /
L)]-1 .
Back