


7.6. Anisotropies
Since the COBE discovery of hot and cold spots in the CMB,
anisotropy detections have been reported
by more than two dozen groups with various instruments, at various
frequencies and in various patches and swathes of the microwave sky.
Figure 10 is a compilation
of the world's measurements (including the recent WMAP results).
Measurements on the left (low
 's) are at large
angular scales while most recent measurements are trying to constrain
power at small angular scales. The dominant peak at
~ 200 and the smaller
amplitude peaks at smaller angular scales are due
to acoustic oscillations in the photon-baryon fluid in cold dark matter
gravitational potential wells and hills.
The detailed features of these peaks in the power spectrum are dependent
on a large number of cosmological parameters.
's) are at large
angular scales while most recent measurements are trying to constrain
power at small angular scales. The dominant peak at
~ 200 and the smaller
amplitude peaks at smaller angular scales are due
to acoustic oscillations in the photon-baryon fluid in cold dark matter
gravitational potential wells and hills.
The detailed features of these peaks in the power spectrum are dependent
on a large number of cosmological parameters.
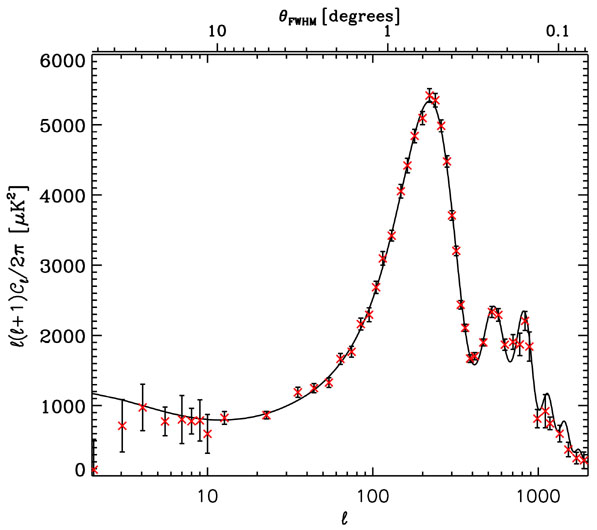 |
Figure 10. Measurements of the CMB power
spectrum. CMB power spectrum from the world's combined data,
including the recent WMAP satellite results
(Hinshaw et al. 2003).
The amplitudes of the hot and cold spots in the CMB depend on their angular
size. Angular size is noted in degrees on the top x axis.
The y axis is the power in the temperature fluctuations.
No CMB experiment is sensitive to this entire range of angular scale.
When the measurements at various angular scales are put together they
form the CMB power spectrum.
At large angular scales ( |
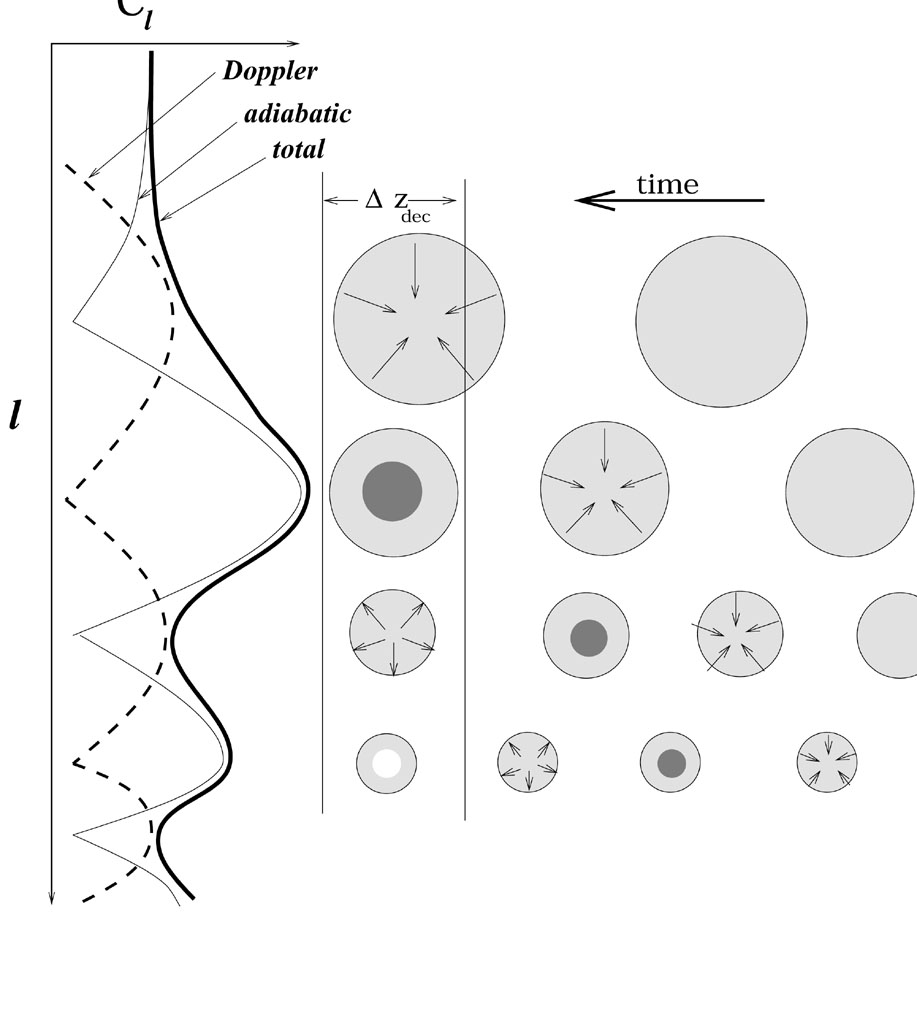 |
Figure 11. The dominant acoustic peaks in
the CMB power spectra are caused by the collapse of dark matter
over-densities and the oscillation of the photon-baryon fluid into and
out of these over-densities. After matter becomes the dominant
component of the Universe, at zeq
|
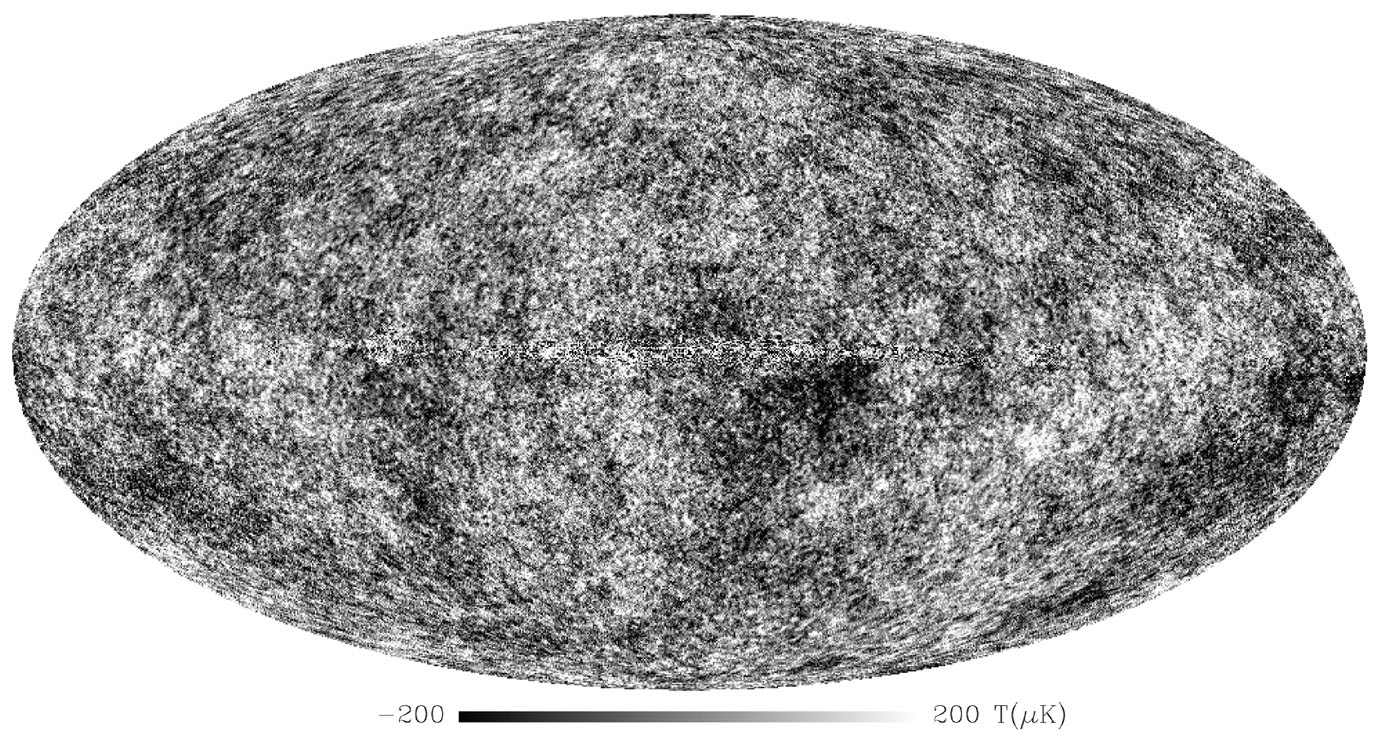 |
Figure 12. Full sky temperature map of the cosmic microwave background derived from the WMAP satellite (Bennett et al 2003, Tegmark et al 2003). The disk of the Milky Way runs horizontally through the center of the image but has been almost completely removed from this image. The angular resolution of this map is about 20 times better than its predecessor, the COBE-DMR map in which the hot and cool spots shown here were detected for the first time. The large and small scale power of this map is shown separately in the next figure. |
 100), the
temperature fluctuations are on
scales so large that they are `non-causal', i.e., they have physical sizes
larger than the distance light could have traveled between the big bang
(without inflation) and their
age at the time we see them (300,000 years after the big bang).
They are either the initial conditions of the Universe or were laid down
during an epoch of inflation ~ 10-35 seconds after the big
bang. New data are being added to these points every few months.
The concordance model shown has the following cosmological parameters:
100), the
temperature fluctuations are on
scales so large that they are `non-causal', i.e., they have physical sizes
larger than the distance light could have traveled between the big bang
(without inflation) and their
age at the time we see them (300,000 years after the big bang).
They are either the initial conditions of the Universe or were laid down
during an epoch of inflation ~ 10-35 seconds after the big
bang. New data are being added to these points every few months.
The concordance model shown has the following cosmological parameters:

 =
0.743,
=
0.743,
 = 0.12 and
no hot dark matter (neutrinos)
(
= 0.12 and
no hot dark matter (neutrinos)
( 2 fits of this
data to such model curves yields the estimates in
2 fits of this
data to such model curves yields the estimates in
 3233 (see
 zdec
(
zdec
(