


The Hubble Space Telescope has proved well suited for the study of objects in our own solar system. In fact, it has produced images of the outer planets that approach the clarity of those obtained from Voyager flybys. The Hubble Space Telescope's images of Mars have also been surpassed only by close-up shots taken by visiting space probes. The Hubble Space Telescope's images of the auroras of Jupiter and Saturn, of the disintegration of comet LINEAR, of the binary Kuiper belt object KBO 1998 WW31, and of a global dust storm on Mars have been truly spectacular and informative. However, no observation could compete with the drama provided by Comet Shoemaker-Levy 9 (SL-9) slamming into Jupiter.
2.1. The collision of Comet SL-9 with Jupiter
From a cosmic perspective, the impact of the ninth periodic comet discovered by the team of Carolyn and Gene Shoemaker and David Levy on Jupiter was unremarkable. The cratered surfaces of many planetary bodies and satellites and the prehistoric mass extinctions on Earth are a testament to the fact that such impacts are ubiquitous in the history of the solar system. Furthermore, even the "seeds" of life on Earth may have been planted by such a bombardment.
From a human perspective, however, this collision marked a "once in a lifetime" event, which caused the mobilization of all the astronomical resources for an unprecedented observational campaign in July 1994.
The Hubble Space Telescope played a crucial role in the SL-9 campaign, both in the initial characterization of the comet fragments and in producing unique images and spectra of the impact events themselves and later of the impact sites.
The multiple comet SL-9 was discovered in late-March 1993 (Shoemaker et al. 1993). Subsequent images taken with HST in July of 1993 (Weaver et al. 1994) revealed that the comet had spectacularly split into 20-odd fragments, probably because of tidal disruption (during a previous close approach to Jupiter), producing a train of fragments fittingly dubbed a "string of pearls" (Fig. 2).
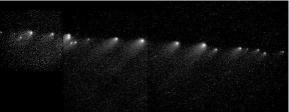 |
Figure 2. Comet P/Shoemaker-Levy 9 (1993e)
"String of Pearls," HST/WFPC2, January 1994.
Credit: NASA, H. A. Weaver (JHU) and T. E. Smith (STScI). |
The conditions for tidal break-up of a self-gravitating incompressible cometary sphere can generally be written in the form (e.g., Dobrovolskis, 1990, Sekanina et al. 1994)
 |
(1) |
where
 c,
p
are the densities of the comet and planet, respectively,
Rp is the planet's radius, d is the distance of
the comet from the planet, Pc is the comet's central
pressure, U is a measure of the comet's tensile strength, and
k is a constant of order unity. The facts that: (i) secondary
fragmentation was observed by HST, and (ii) the gradual
disappearance of condensations was also well documented by HST
Weaver et
al. 1995),
argued strongly for tidal splitting of a discrete nucleus as a result of
gradual fissure propogation. Computations of the orbit suggested that
the comet would collide with Jupiter in July 1994
(Nakano 1993,
Yeomans and
Chodas 1993).
c,
p
are the densities of the comet and planet, respectively,
Rp is the planet's radius, d is the distance of
the comet from the planet, Pc is the comet's central
pressure, U is a measure of the comet's tensile strength, and
k is a constant of order unity. The facts that: (i) secondary
fragmentation was observed by HST, and (ii) the gradual
disappearance of condensations was also well documented by HST
Weaver et
al. 1995),
argued strongly for tidal splitting of a discrete nucleus as a result of
gradual fissure propogation. Computations of the orbit suggested that
the comet would collide with Jupiter in July 1994
(Nakano 1993,
Yeomans and
Chodas 1993).
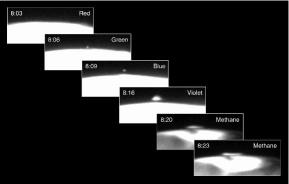 |
Figure 3. Series of images showing the impact of Comet P/Shoemaker-Levy 9 (1993e) fragment W on Jupiter, HST/WFPC2, July 22, 1994. Credit: NASA and the HST Comet Impact Team. |
The impact of the first fragment (fragment "A") occurred on
July 16, 1994, followed by all the other fragments smashing into
Jupiter's atmosphere over the following week. The Hubble Space
Telescope's images taken during the impact events
(Hammel et
al. 1995)
showed spectacular plumes resembling nuclear "mushrooms" above the limb
of Jupiter (Fig. 3). Typically, the plumes
attained altitudes of
about 3000 km within 6-8 minutes of impact, and were seen falling
and spreading within 10 minutes of impact. The manner in which the
height of the plume scales with SL-9 parameters and the ambient pressure
can be obtained from the following simple considerations (e.g.,
Chyba et al. 1993,
Field and Ferrara
1995,
Zahnle and MacLow
1994).
Once aerodynamic forces overcome material strength, the incoming
fragment deforms to form a flattened "pancake" due to the difference in
ram pressure acting on the front and on the sides. Due to the increase
in the cross-section (and concomitantly in the drag), the fragment is
brought to an abrupt halt, accompanied by an explosive energy
release. If we denote the energy being released per steradian by
Ei / 4 , then
the obtained ejection velocity is given by
, then
the obtained ejection velocity is given by
 |
(2) |
where
a,
Pa are the ambient density and pressure, respectively,
H is the pressure scale height in the atmosphere and g is
the gravitational acceleration. The plume height, therefore, scales like
 |
(3) |
Detailed numerical simulations have confirmed the basic physical picture described above (e.g., MacLow 1996).
A combination of the observations from the Keck Telescope, HST, Palomar, and the Galileo spacecraft, eventually produced a comprehensive explanation for the observed 2.3µ lightcurve (shown in Fig. 4 for fragment R; Graham et al. 1995). The sequence of events can be described phenomenologically by the cartoon in Fig. 5 (Zahnle 1996).
 |
Figure 4. The light curve from the impact of fragment R at 2.3 µ, adapted from Graham et al. 1995 and Zahnle 1996. |
 |
Figure 5. The viewing geometry of a typical SL-9 impact (see text; adapted from Zahnle 1996). |
The first precursor marked the meteor trail (with a brightening timescale of order H/v ~ 1 s). As explained above, most of the fragment's kinetic energy was released at the last second of its existence, resulting in an explosive fireball. The second precursor marks the rise of the fireball above Jupiter's limb, having already cooled to ~ 500-700 K (Carlson et al. 1995). As the fireball expanded, silicates condensed, followed by carbonaceous matter. The sunlit parts of these condensates were the tracers that marked the plume seen by HST. The main peak in the light curve was caused by the ejecta plume falling back onto the atmosphere (Nicholson et al. 1995). The rise and fallback occurred on a timescale of (8 hplume / g)1/2 ~ 103 s (for a plume height of ~ 3000 km). The final, smaller peak, was probably caused by material bouncing off the atmosphere and falling back.
Another interesting phenomenon revealed by the HST images of the impact sites was the propagation of waves (Fig. 6). The radius of the prominent dark ring in Fig. 6 is 3700 km, and a smaller ring, of radius 1750 km is also visible (Hammel et al. 1995).
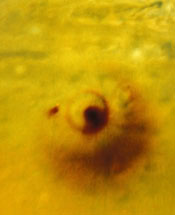 |
Figure 6. Flat Projection of Comet P/Shoemaker-Levy 9 (1993e) Fragments D (left) and G Impacts on Jupiter, HST/WFPC2, July 18, 1994. Two rings of propagating waves can be seen. Credit: NASA and the HST Comet Impact Team. http://hubblesite.org/newscenter/archive/1994/36/ |
Measurements of the radii of the circular rings as a function of time showed that the "fast" wave was seen to spread at a constant speed of 450 m s-1, while the speed of the "slow" wave (corresponding to the fainter ring) was somewhat less constrained. Ingersoll and Kanamori (1996) examined many possibilities for the identification of the fast wave, including f-modes, p-modes, r-modes and g-modes. These waves are classified by the different restoring forces that cause them to propagate. In acoustic waves (p-modes) the restoring force is compressibility; in surface waves (like those in the ocean; f-modes) it is gravity; in inertial oscillations (r-modes) it is the Coriolis force, and in internal gravity waves (g-modes) it is gravity. Ingersoll and Kanamori showed that the only waves that match the observed speed of 450 m s-1 are g-modes propagating in a water cloud which has an O/H ratio that is ten times higher than that ratio in the Sun, eH2O = 10 (the waves were too slow to be acoustic waves and moved at too constant a speed to be rings of debris). The propagation speed of these modes varies as the square root of the water abundance. The requirement of a high O/H ratio was found to be in conflict with data from the Galileo probe, which suggested that from above the cloud tops down to the 20 bar level the water was less abundant than in the Sun. The cause for this discrepancy is still unknown, although it has been suggested that the probe may have entered a clearing in the clouds (a "5-micron hot spot") associated with a dry downdraft. This uncertainty demonstrates that even the highest quality data do not provide all the answers. Nevertheless, there is no question that the impact of comet SL-9 on Jupiter provided a unique opportunity to study such events.