Copyright © 1999 by Annual Reviews. All rights reserved
| Annu. Rev. Astron. Astrophys. 1999. 37:
127-189 Copyright © 1999 by Annual Reviews. All rights reserved |


Evidence that galaxies have dark halos comes from the kinematical and dynamical studies of galaxies. However, the geometry of the halos and the amount and distribution of dark matter are unknown and in practice difficult to probe. Gravitational lensing could provide valuable insight in this field: because it works on all scales, in principle the halos of galactic dark matter should be observed from their gravitational lensing effects on background galaxies. The first Einstein rings and the other galaxy-scale lensing candidates have provided unique opportunities to measure the mass-to-light ratios and to probe the mass profiles of a few galaxies (Kochanek 1991). In the case of rings, the mass of the lensing galaxies can be very well constrained (see, for instance, Kochanek 1995), so the properties of the halos inferred from modeling are reliable. However, Einstein rings are rare lensing events, so the sample is still very small.
A more promising approach consists of a statistical study of the
deformation of distant galaxies by foreground galactic halos. The
galaxy-galaxy lensing analysis uses the correlation between the position
of foreground galaxies and the position-alignment
of their angular-nearest neighbors among the background population.
If the alignment is assumed to be produced by the gravitational shear of
the foreground halos, then it is possible to probe the mass of the
halos, if the redshift distributions of the
foregrounds and the backgrounds are known. A statistical analysis is
then possible, if one assumes that all the foreground galaxies
have similar halos, which can be scaled using the Tully-Fisher relation
and the photometric data (galaxy luminosity). The expected gravitational
distortion is very weak: for foregrounds at redshift <
zl > = 0.1, backgrounds at
< zs > = 0.5, and typical
halos with velocity dispersion of 200 km s-1 and radius of 100
kpc, | |
|
 1% at
about 20 kpc from the center. But if the observations go to very faint
magnitudes there is a huge number of background lensed galaxies, so that
the weakness
of the signal is compensated by the large statistics. It is worth
pointing out that the signal-to-noise ratio depends on the number of
galaxy pairs, so
either very wide field shallow surveys or ultra-deep imaging can be used
for the statistics (although they will not probe similar angular scales).
1% at
about 20 kpc from the center. But if the observations go to very faint
magnitudes there is a huge number of background lensed galaxies, so that
the weakness
of the signal is compensated by the large statistics. It is worth
pointing out that the signal-to-noise ratio depends on the number of
galaxy pairs, so
either very wide field shallow surveys or ultra-deep imaging can be used
for the statistics (although they will not probe similar angular scales).
Tyson et al (1984)
made the first attempt, using
approximately 50,000 background and 11,000 foreground galaxies obtained
from photographic plates. The
3 upper limit of the
circular velocity that they found
was 160 km s-1, with a maximum cutoff radius below
50 h100-1 kpc. These values
are significantly smaller than theoretical expectations from rotation
curves and dynamical analyses of galaxies. However, despite a careful
examination of possible systematics
(Tyson et al 1984,
Tyson 1985),
there are two limitations to Tyson et al's pioneering work. First, as
emphasized by
Kovner & Milgrom
(1987), the assumption that background galaxies are at
infinite distances has considerable impact on the constraints on the
circular velocity and the cutoff radius. If one includes a corrective
factor which takes into account the distances of the sources, the upper
limit
for the circular velocity is considerably higher (330 km s-1
for a L* galaxy) and no constraints
can be put on the cutoff radius
(Kovner & Milgrom
1987). Second, the image
quality of the photographic plate is poor and may also affect the
measurement of weak distortions.
upper limit of the
circular velocity that they found
was 160 km s-1, with a maximum cutoff radius below
50 h100-1 kpc. These values
are significantly smaller than theoretical expectations from rotation
curves and dynamical analyses of galaxies. However, despite a careful
examination of possible systematics
(Tyson et al 1984,
Tyson 1985),
there are two limitations to Tyson et al's pioneering work. First, as
emphasized by
Kovner & Milgrom
(1987), the assumption that background galaxies are at
infinite distances has considerable impact on the constraints on the
circular velocity and the cutoff radius. If one includes a corrective
factor which takes into account the distances of the sources, the upper
limit
for the circular velocity is considerably higher (330 km s-1
for a L* galaxy) and no constraints
can be put on the cutoff radius
(Kovner & Milgrom
1987). Second, the image
quality of the photographic plate is poor and may also affect the
measurement of weak distortions.
The first attempt to use deep CCD subarcsecond images was made
by Brainerd et al (1996)
using about 5,000 galaxies.
The distortion was compared with simulations, based on
analytical profiles for the dark matter halos, and the Tully-Fisher
relation, in order to relate mass models to observations. After careful
investigations of systematics, they detected a significant polarization
of about 1%, averaged over a separation between 5" and 34"
(see Figure 9). They concluded
that halos smaller than 10h-1 kpc are excluded at a
2 level, but the data
are compatible with halos larger
than 100h-1 kpc and circular velocities of 200 km
s-1. Similar works using 23,000 galaxies
have been done recently using very deep images obtained with MOCAM at CFHT
(Cuillandre et al 1996)
with seeing below 0.7". They found
remarkably similar results as Brainerd et al for the polarization and
its evolution with radius (Erben et al, in preparation).
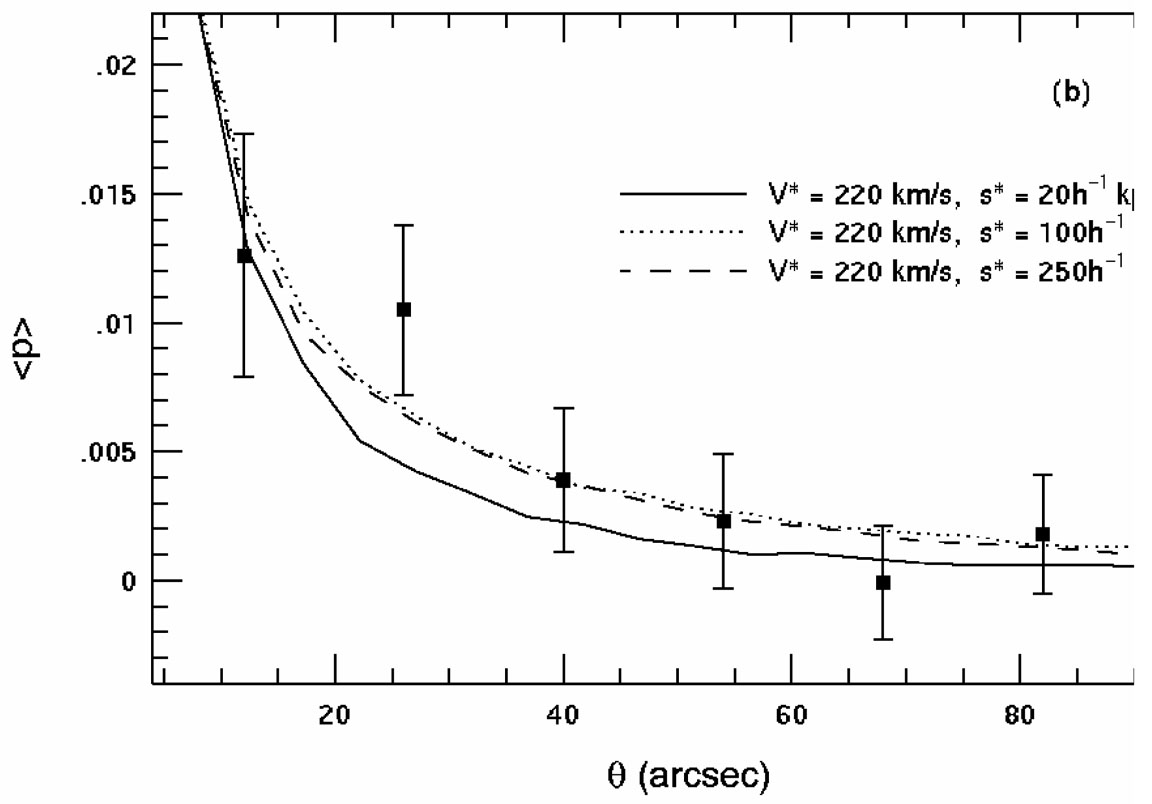 |
Figure 9. Angular variation of polarization produced by weak lensing of foreground galaxies on the background (lensed) sources in the Brainerd et al (1996) sample. The lines show theoretical expectations for three models of halos having different velocity dispersion and scales. |
The HST data look perfectly suited for this kind of program which demands high image quality and the observation of many field galaxies. Griffiths et al (1996) used the Medium Deep Survey (MDS) and measured the distortion produced by foreground elliptical and spiral galaxies. They found results similar to those of Brainerd et al (1996) but with a signal more significant for foreground elliptical than spiral galaxies. The comparison with shear signals expected from various analytical models seems to rule out de Vaucouleurs' law as mass density profile of ellipticals. Ebbels et al (in preparation) are now extending the MDS work to a larger sample, trying to simulate more carefully the selection effects. Dell'Antonio & Tyson (1996), Hudson et al (1998) analyzed the galaxy-galaxy lensing signal in the HDF. As compared with the ground-based images or the MDS, the field is small but the depth permits the use of many background galaxies even on a scale smaller than 5 arcseconds. Furthermore, the UBRI data of the HDF permit the inference of accurate photometric redshifts for the complete sample of galaxies. Dell'Antonio & Tyson compared the lensing signal with predictions from an analytical model for the halo. They found a significant distortion of about 7% at 2" from the halo center which corresponds to halos with typical circular velocities of less than 200 km s-1. The results obtained by Hudson et al (1998) are consistent with those of Dell'Antonio & Tyson (1996), Brainerd et al (1996). However, their maximum-likelihood analysis more accurately takes into account the collective effects of large-sized halos (Schneider & Rix 1997). In contrast to previous studies, Hudson et al made careful corrections of images from the PSF and scaled the magnitude inferred from the analytical models of the halos using the Tully-Fischer relation.
Galaxy-galaxy lensing is potentially a very valuable tool for studying the dynamics of galaxies, complementary of standard methods using photometry and spectroscopic data. Because the foreground galaxies have an average redshift of approximately 0.1, galaxy-galaxy lensing also offers an opportunity to look at the dynamical evolution of galaxies by comparing local galaxies at redshift zero to intermediate-redshift galaxies (Hudson et al 1998). However, there are still some limitations due to the rather small number of galaxies used in each sample. As shown from the simulations by Schneider & Rix, it is rather easy to constrain the velocity dispersion of the halos, but more difficult to put limits on their physical scale (see Figure 10). There are also uncertainties coming from the models of halos (which are assumed to be spherical) and the additional noise produced by cosmic shear which can contaminate the galaxy-galaxy signal. Although these issues should be analyzed in more detail in the future, dramatic changes in the results are not expected (Schneider & Rix 1997). In particular, the weak lensing induced by large-scale structures should indeed be canceled by the averaging procedure of galaxy-galaxy lensing.
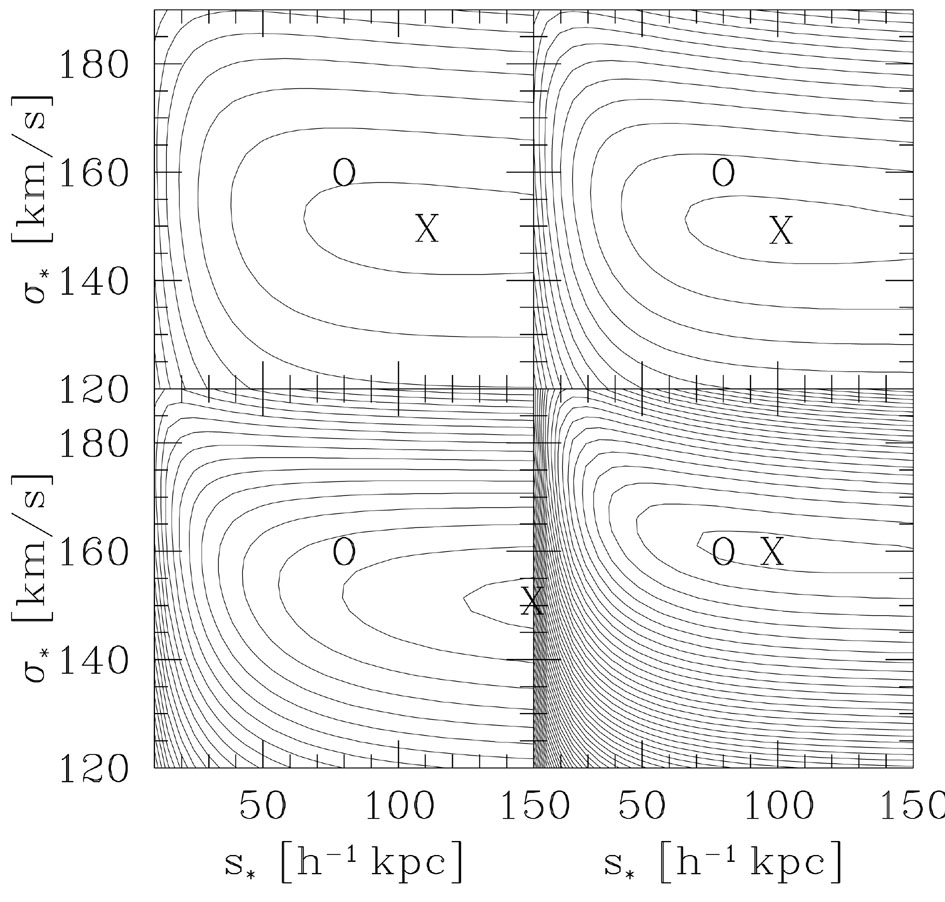 |
Figure 10. Simulations of galaxy-galaxy lensing done by Schneider & Rix (1997) for four samples of galaxies: 795 (top left), 1165 (top right), 2169 (bottom left) and 3137 (bottom right). The O symbol indicates the input parameters of the model and the X shows the maximum of the likelihood function. The likelihood isocontours shows that the velocity dispersion is recovered easily, in contrast to the scale which requires many more galaxies. |