Copyright © 1999 by Annual Reviews. All rights reserved
| Annu. Rev. Astron. Astrophys. 1999. 37:
127-189 Copyright © 1999 by Annual Reviews. All rights reserved |


6.1. Redshift Distribution of Galaxies Beyond B = 25
Gravitational lensing magnifies part of the distant universe and permits exploration of the redshift distribution of faint galaxies as well as the morphology and the contents of very distant galaxies. As discussed in Section 4.4, information on the distances of the sources is relevant for the weak lensing inversion, because the mass reconstruction uses a grid of faint distant sources whose redshift distribution is basically unknown. In particular, this hampers the mass estimates of high-redshift lensing clusters which are very sensitive to the redshifts of the background sources (Luppino & Kaiser 1997). Unfortunately, beyond B = 25, even giant optical telescopes are too small for spectroscopy and the redshift of a complete sample of B > 25 galaxies cannot be secured in a reasonable amount of observing time. The possibility of using photometric redshifts is very promising, but observations as well as tests of the reliability of the method for the faintest galaxies are still underway and require careful control. Moreover, because it is hopeless to calibrate the photometric redshifts of the faint samples with spectroscopic data, a cross-check of the predictions of photometric redshift and "lensing-redshift" is important.
6.1.1. Spectroscopic Surveys of Arclets
Spectroscopic surveys of redshifts of arc(let)s are long and difficult tasks but are definitely indispensable for lensing studies. They permit computation of the angular distances DOL, DLS and DOS and therefore obtain the absolute scaling of the projected mass density. These redshifts also directly probe the positions of critical lines which eventually constrain the local mass distribution for some detailed models (Kneib et al 1993, 1996;, Natarajan et al 1998; Kneib et al, in preparation). The development of the lensing inversion technique (see Section 6.1.2) also requires spectroscopic confirmations of its predictions to demonstrate that this is a reliable and efficient method. Last but not least, it is in principle also possible to obtain information on the cosmological parameters if one could have enough redshifts to constrain both the mass distribution of the lens and the geometry of the Universe.
Spectroscopic surveys of the "brightest" arclets in many clusters are progressing well. Some extremely distant galaxies have been discovered, such as the arc(let)s in Cl13587+6245 at z = 4.92 (Franx et al 1997, see Figure 11), in A1689 at z = 4.88 (Frye & Broadhurst, private communication), in A2390 at z = 4.04 (Frye & Broadhurst 1998), in Cl0939+4713, where three z > 3 arcs have been detected (Trager et al 1997), or the hyperluminous galaxy in A370 at z = 2.8 (Ivison et al 1998). Extensive spectroscopic follow-up is also under way in A2390 (Bézecourt & Soucail 1997, Frye et al 1998) and in A2218 (Ebbels et al 1996, 1998). The spectroscopic observation by Frye et al (1998) is a good example of what could be expected from redshifts of arc(let)s: from their Keck observations, they show that the straight arc in A2390 is actually composed of two lensed galaxies aligned along the same direction, one at z = 0.931 (reported earlier by Pelló et al 1991) and the other one at z = 1.033. These observations confirm the early conclusions from multicolor photometry (Smail et al 1993) as well as from theoretical considerations (Kassiola et al 1992b) that this straight arc should be composed of two galaxies.
 |
Figure 11. The giant arc detected in
Cl1358+6245 is the most distant arc ever observed (z =
4.92). The
strong magnification permits the detection of some inner structures in a
lensed galaxy at z
|
About 50 redshifts of arc(let)s have been measured so far. However, from this sample it is difficult to infer valuable information on the redshift distribution of B > 25 galaxies or to constrain evolution models of galaxies because it is biased in an unknown way. Since most of these objects are very faint, only arclets showing bright spots on HST images revealing star-forming regions are generally selected. These features, which increase the probability of detecting emission lines, optimize the chance to get reliable redshifts but generate a sample of arclets where star forming galaxies are preferentialy selected. Furthermore, owing to the steep slope of galaxy counts beyond B = 25 the magnification bias favors observations of blue galaxies rather than red ones. So, even if the spectroscopy of arclets is crucial for the lens modeling and eventually to obtain the spectral energy distribution of high-redshift galaxies, the spectroscopic sample of arc(let)s must be handled carefully and a detailed analysis of the selection function is needed prior to statistical studies. In the meantime, it is important to focus on getting a few spectra of extremely high-redshift galaxies (z > 5) that could be observable thanks to high magnification.
6.1.2. Redshift Distribution from Lensing Inversion
If it is possible to recover the lensing potential with good
accuracy, the lensing equation can be inverted in order to send the
lensed image back to its source plane. The shape of the source can in
principle be
predicted for any redshift beyond the lens position. The basic
principle of the lensing-inversion approach was initially discussed
by Kochanek (1990)
and refined later
by Kneib et al (1994,
1996).
If the shape of the galaxies sent back beyond the lens plane is
parameterized by the quantity
 = (a2 -
b2) / 2ab e2i
= (a2 -
b2) / 2ab e2i
 , then it is
easy to show that in the weak lensing regime, the complex quantity
, then it is
easy to show that in the weak lensing regime, the complex quantity
 I and its
projection on a y-axis,
y, writes
(Kneib et al 1994,
1996):
I and its
projection on a y-axis,
y, writes
(Kneib et al 1994,
1996):
 |
(38) |
where the subscripts I and S
refer to the image and the source, respectively. Therefore,
y is an
invariant. The conditional probability of a
source to be at redshift z, given the shape and
the position of the image, and for a given mass model is:
 |
(39) |
For a simple distribution of the shape of the sources, it turns out that this probability is maximum at the redshift where the deformation of the source is minimized. Therefore, the lensing-inversion predicts that the most probable redshift, for a given model, is where the unlensed galaxies have a minimum ellipticity. This intuitive assumption proposed by Kneib et al (1994) was established on an observational basis by Kneib et al (1996) using the HST-MDF galaxies as a fair sample of unlensed sources. The obvious interest of this method is that it does not depend on the magnitude of the arclet but on its position and its shape in the image plane. Potentially, it provides the redshift of any arclet up to the limiting magnitude of the observations.
The lensing inversion was first applied on A370 (Kochanek 1990, Kneib et al 1994), from the lens modeling of the giant arc and some multiple images. Though the (unlensed) magnitude-redshift diagram found for these arclets shows a good continuity with the faint spectroscopic surveys (Mellier 1997), some of the predicted redshifts are uncertain. In fact, as shown by Fort & Mellier (1994, Figure 12), the X-ray isophotes and the arclet positions do not follow the expectations of the lens modeling of the eastern region. This is an indication that although the modeling is excellent in the cluster center, the mass distribution does not have a simple geometry beyond the giant arc and therefore the lens model in this region is uncertain. Similar complex substructures could exist on scales below the resolution of the mass maps and could also produce wrong redshift estimates. Furthermore, the lensing inversion is also sensitive to the accuracy of the shape measurements of each arclet, which in the case of very faint objects could be an important source of uncertainty.
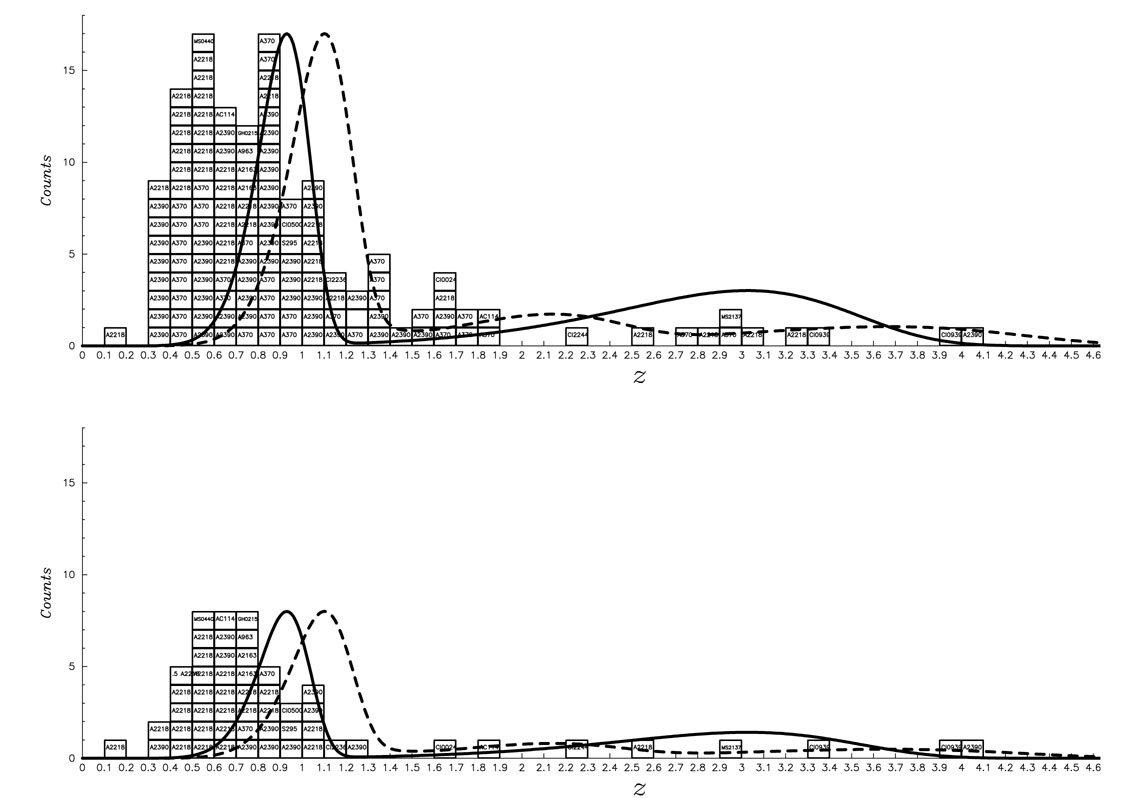 |
Figure 12. Redshift distribution inferred from lensing techniques. The bottom panel is the spectroscopic sample of arc(let)s compiled from the literature. The top panel includes the spectroscopic sample and the redshift predictions of arclets from lensing inversion. On both histograms, the plots of the redshift distributions from the depletion curves in B (solid line) and I (dashed line) prediction by Fort et al (1997) are shown. |
There are two solutions to solve these issues: first, it is highly preferable to use HST images instead of ground based images. The recent spectroscopic confirmations by Ebbels et al (1996, 1998) of most of the redshifts predicted from the lensing-inversion in A2218 from the HST data (Kneib et al 1996) are wonderful demonstrations of the capabilities of such a technique when used with superb images. Second, it is important to focus on lensing-clusters with simple geometry in order to lower the uncertainties on the lens modeling. In this respect, though A370 and A2218 are rather well modeled, they are not the simplest, and clusters such as MS0440, A1689 or MS2137-23 appear to be better candidates.
6.1.3. Probing Source Redshifts Using Various Lens Planes
A more natural and simple way to infer the redshift distribution of the faint galaxies is to look for arc(let)s or weak lensing signals through a set of different lensing clusters having increasing redshifts. The ratio of lensed versus unlensed faint galaxies and the amplitude of the shear patterns as a function of redshift directly probe the spatial distribution of the galaxies along the line of sight. This idea was tentatively explored by Smail et al (1994) who analyzed the lensing signal in three lensing clusters at redshifts 0.26, 0.55 and 0.89. They found that most I < 25 objects cannot be low-z dwarf galaxies and concluded that a large fraction of I = 25 galaxies are beyond z = 0.55. The absence of any significant lensing signal in the most distant cluster led to inconclusive results on the fraction of these galaxies that could be at very large redshift. Fortunately, the distant clusters observed by Luppino & Kaiser (1996) and Clowe et al (1998) provided considerable insights about the high-redshift tail of faint galaxies. The detection of weak lensing in three z > 0.75 clusters put strong constraints on their samples of 23.5 < I < 25.5 galaxies, which must be dominated by a z > 1 population. These three lensing clusters strengthen the conclusions obtained from the shear detected around Q2345+007 (Bonnet et al 1993) which is also produced by a high-redshift cluster (Mellier et al 1994, Fischer et al 1994, Pelló et al 1996).
The use of distant clusters is promising because it is a direct consequence of the detection of weak lensing signals, regardless of the accuracy of the mass reconstruction. The shape of the redshift distribution of the galaxies can be inferred if many clusters at different redshifts map the lensing signal. Up to now, the number of clusters is still low, but it will continuously increase during the coming years. However, it is worth noting that the derived shape of the redshift distribution also depends on the accuracy of the lens modeling, as well as on the dynamical evolution of clusters with look-back time. At high redshift it is possible that the lensing signal decreases rapidly, not only because of the absence of background sources, but also because clusters of galaxies are no longer dense and massive enough to produce gravitational distortion. It will be important to disentangle these two different processes.
6.1.4. The Distribution of Faint Galaxies From the Magnification Bias
When the slope of the galaxy number count is lower than 0.3, a sharp decrease in the galaxy number density is expected close to the critical radius corresponding to the redshift of the background sources (see Equation 24). For a broad redshift distribution, the cumulative effect of each individual redshift results in a shallow depletion area which spreads over two limiting radii corresponding to the smallest and the largest critical lines of the populations dominating the redshift distribution. Therefore, the shape and the width of depletion curves reveal the redshift distribution of the background sources, and their analysis should provide valuable constraints on the distant galaxies. Similar to the lensing inversion, this is a statistical method that also needs a very good modeling of the lens; but in contrast to it, it does not need information on the shapes of arclets, so the "depletion-redshift" could be a more relevant approach for very faint objects.
This method was first used by Fort et al (1997) in the cluster Cl0024+1654 to study the faint distant galaxy population in the extreme magnitude ranges B = 26.5-28 and I = 25-26.5. The (unlensed) galaxy number counts were first calibrated using CFHT blank fields and checked from comparison with the HST-HDF counts. In this magnitude range, the slopes are close to 0.2, so these populations can produce a highly contrasted depletion area, so they are best suited for this project. In this cluster, the lower boundary of the depletion is sharp and the growth curve toward the upper radius extends up to 60 arcseconds from the cluster center, as expected if the high-redshift tail is a significant fraction of the lensed galaxies. Fort et al concluded that 60% ± 10% of the B-selected galaxies are between z = 0.9 and z = 1.1 while most of the remaining 40% ± 10% galaxies appear to be broadly distributed around a redshift of z = 3. The I selected population shows a similar bimodal distribution, but spreads up to a larger redshift range with about 20% above z > 4.
There is no spectroscopic confirmation yet that the double-shape redshift distribution predicted by Fort et al is real. Indeed, there are still uncertainties related to this method: in the particular case of Cl0024+1654, the redshift of the arc used to scale the mass was assumed to be close to 1. We know from recent Keck spectroscopic observation that this arc is at redshift 1.66 (Broadhurst et al 1999), so the innermost calibration of the sources has to be rescaled. The method is also sensitive to the lens modeling of the projected mass density. In the case of Cl0024+1654, it is rather well constrained from the subarcsecond ultra-deep images of Fort et al, and the predicted velocity dispersion is very close to the measured values from the galaxy radial velocities (Dressler & Gunn 1992).
This approach was recently generalized by Bézecourt et al (1998), in order to predict the number counts of arc(let)s with a magnification larger than a lower limit. The prediction first needs a model for galaxy evolution that reproduces some typical features of field galaxies, such as the observed galaxy counts and redshift distributions of spectroscopic surveys. The best final model can then be used to predict the number of arc(let)s brighter than a lower surface brightness limit and with magnification larger than a lower limit, for any lensing cluster whose mass distribution can be modeled properly. Bézecourt et al (1998, 1999) used this technique to build the best model capable of producing the number of arc(let)s observed in A370 and A2218. They also predicted a bimodal redshift distribution, but their expected number of giant arcs is overestimated by a factor of two. This inconsistency is still difficult to interpret. Indeed, the method should be handled carefully, because it both depends on the modeling of the lens and on the modeling of galaxy evolution. In particular, fitting of counts and redshift distributions of galaxies produces models that have degeneracies (Charlot 1999) that are potential limitations. Nevertheless, like the Fort et al (1997) method, the Bézecourt et al generalization is an interesting and original idea which can certainly be improved in the future using much better data. As compared with the lensing-inversion, it does not depend on the shapes of distant galaxies, and just needs very deep counts [the Bézecourt et al (1998, 1999) method does require shapes of lensed galaxies, but they only use reasonably magnified arc(let)s, so it is not a difficulty]. In the "depletion-redshift" technique this is a great advantage for the faintest (most distant?) objects, because, as the HDF images show, many of them have bright spots but do not show regular morphologies, so the lensing-inversion procedure could be inefficient for these galaxies. These very first attempts must be pursued on many lensing clusters in order to provide reliable results on the redshift distribution of the faintest galaxies.
The redshift distribution obtained by these various techniques is summarized in Figure 12. The distribution is broad and the comparison with Figure 9 of Fort & Mellier (1994) shows that the median redshift and the width of the distribution increases continuously. The median redshift distribution of giant arcs was close to 0.4 four years ago and has increased up to 0.7 but with a more pronounced high-redshift tail. A significant fraction of the new redshifts exceeds 1.5, with a visible trend toward very high redshifts (z > 2.5). The median redshift obtained from lensing inversions is close to 0.7, a good correlation with other methods. It is surprising to see that the redshift distribution obtained by the depletion curves predict two peaks which seem to be visible in the redshift distribution of arc(let)s as well, both on the spectroscopic and lensing inversion samples. Owing to the somewhat different selection criteria used for these two samples, a resemblance was not really expected, and it may be an indication that selection biases in the spectroscopic sample of arc(let)s are not critical.
Because the observations of lensed galaxies simultaneously use magnification, color selection, shape selection (elongation) and relative position with respect to the cluster center (deviation angle), it is possible to jointly select drop-out galaxies with the radial-distance criterion of an elongated object in order to select extremely distant galaxies. Because this method seems to be efficient, it will certainly be applied to select samples of z > 5 galaxies. This will probably be a main goal for the future.
 5. Many bright spots
are visible
(
5. Many bright spots
are visible
(