


7.5. Some Mapping Results So Far (~ 10-3 Gauss)
Published data on the observed protostellar disks and cloudlets with observed magnetic fields have been culled from the literature, and preliminary statistics have been performed on them.
Table 1 shows the accumulation of
the published data
(Vallée &
Bastien 1998).
The first columns give the disk or cloudlet name, position angle of the
magnetic field direction, position angle of the source elongation, and
angular difference between these two. Other columns give the total (gas
plus dust) density, source diameter
( 1 pc), gas temperature, and
whether there is or not a cold gas companion of similar temperature
(between 10 K and 100 K) located nearby (no more than two disk radii
away). The sources are placed in either
of two categories: (i) those with B field direction roughly
parallel to the source elongation (angle difference less than
45°), and
(ii) those with B field direction roughly perpendicular to the
source elongation (angle difference greater than 45°).
1 pc), gas temperature, and
whether there is or not a cold gas companion of similar temperature
(between 10 K and 100 K) located nearby (no more than two disk radii
away). The sources are placed in either
of two categories: (i) those with B field direction roughly
parallel to the source elongation (angle difference less than
45°), and
(ii) those with B field direction roughly perpendicular to the
source elongation (angle difference greater than 45°).
There is a relative absence of sources with a difference in angles between 30° and 60°. Statistics were performed separately on each category, to yield the mean values and their standard deviations. The results showed that, for most of the physical parameters (see columns) listed in this Table, the sources in the two categories could easily come from the same original parent distribution (same median source density of ~ 106 cm-3, same mean source diameter ~ 0.2 pc, same median source gas temperature ~ 40 K). However, a good trend could be seen in the absence of a companion for most sources (8/11) with a toroidal B, and the presence of a companion/nearby object for most sources (12/13) with a poloidal B.
Figure 19, using data from Table 1, shows the current status of the angle correlation with companionship. There is a surplus of sources with a poloidal magnetic field having a nearby companion (at right), and a surplus of sources with a toroidal magnetic field being isolated (at left).
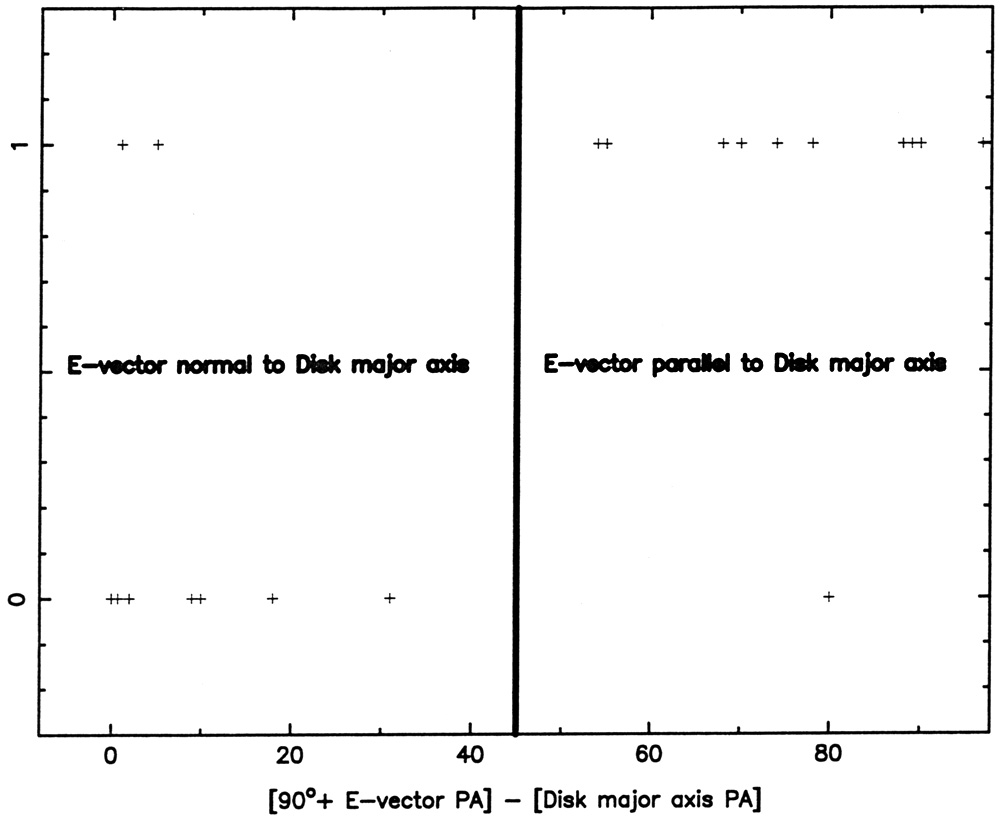 |
Figure 19. Observed difference between the Source magnetic field direction (90° + E-vector PA) minus the Source elongation, versus the absence (bottom) or presence (top) of a nearby cold companion (within 2 disk radii). There is a surplus of sources with a poloidal magnetic field having a nearby companion (at right), and a surplus of sources with a toroidal magnetic field being isolated (at left). |
Figure 20 shows the area around the cloudlet W75N-IRS1, which was observed bolometrically and polarimetrically (Vallée & Bastien 1995) at 800 µm. They found that the continuum flux density and moderate source size (0.12 pc) gave a mean total density of 3 × 106 cm-3, at a dust temperature of 45 K. They also found that, on this size scale, the magnetic field is roughly parallel (B toroidal) to the major axis of the dust/molecular cloudlet (i.e., B is toroidal), and nearly perpendicular to a CO outflow from this object, with a field strength ~ 1 milliGauss. On this scale in W75N-IRS1, the polarimetric data at 800 µm are best interpreted by the following magnetic models: Y-shaped B lines in clump, X-shaped B lines in clump, or B lines in clump perpendicular to B lines outside clump. More data at submillimeter wavelengths are needed to further narrow these possibilities. Near-IR polarimetric maps of W75N-IRS1 are dominated by multiple scattering and may not reveal anything about the magnetic field direction.
 |
Figure 20. Observed magnetic field lines in the interstellar cloudlet W75-IRS1, as seen at the JCMT at a wavelength of 800 microns (Vallée and Bastien, 1995). The magnetic field line (bar) is roughly parallel to the major axis of the cloudlet. At 2 kpc away, 1 arcmin corresponds to 0.6 pc. |
On a smaller scale, Zeeman observations of OH masers at
 18 cm by
Hutawarakorn and Cohen
(1996)
clustering on a small scale (~ 6000AU ~ 9 × 10¹¹
km ~ 0.03 pc) near the protostar in W75N near IRS1/HII(B)
indicated a magnetic field ~ 5 milliGauss oriented parallel
(B poloidal) to the CO outflow. This apparent misunderstanding
(poloidal; toroidal) may be explained by the beam size effect. They also
find some evidence in their data for a magnetic field reversal,
indicative of another, toroidal component perpendicular to the outflow.
18 cm by
Hutawarakorn and Cohen
(1996)
clustering on a small scale (~ 6000AU ~ 9 × 10¹¹
km ~ 0.03 pc) near the protostar in W75N near IRS1/HII(B)
indicated a magnetic field ~ 5 milliGauss oriented parallel
(B poloidal) to the CO outflow. This apparent misunderstanding
(poloidal; toroidal) may be explained by the beam size effect. They also
find some evidence in their data for a magnetic field reversal,
indicative of another, toroidal component perpendicular to the outflow.
Figure 21 shows an example of the magnetic fields in two close clumps, located in source IRAS 4 within the object NGC 1333. The arrows show the direction of the magnetic fields. The magnetic field goes roughly perpendicular to the line joining the two clumps. Here the magnetic fields are observed to point perpendicular to the gas and dust ridge. Typical amplitudes of the magnetic field strength in molecular cloudlets are near 1 mGauss.
 |
Figure 21. Magnetic field observed in source IRAS 4 within the object NGC 1333. Dust emission contours near 870 µm (solid curves) and CO gas line emission near 870 µm (dashed curves) are shown. The bars show the direction of the magnetic fields, measured near 800 µm. In both IRAS4a (at right) and IRAS 4b (at left), the magnetic field goes roughly perpendicular to the line joining the two clumps. At 220 pc away, 1 arcmin corresponds to 0.06 pc. Adapted from Minchin and Murray (1995). |
Figure 22 shows the area around the cloudlets S106-IR and S106-FIR. They were observed near 800 microns (adapted from Holland et al. 1996). A magnetic field roughly parallel to the overall elongation is seen (toroidal magnetic field). This region has been observed in the Zeeman splitting of HI and OH by Roberts et al. (1995), who measured ~ 400 µGauss about 0.1 pc NE and 0.2 pc SW of the Extreme IR core, suggesting a magnetic field perpendicular (B poloidal) to the Extreme IR core elongation. This apparent misunderstanding (poloidal, toroidal) may be explained by the beam size effect mentioned above.
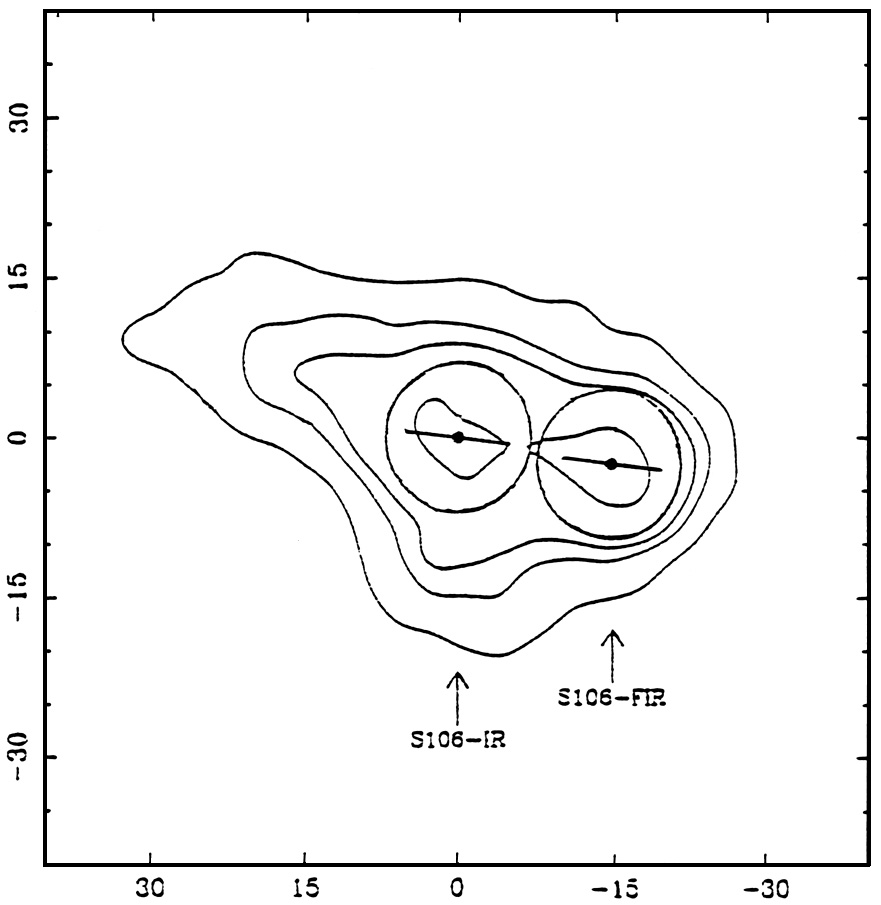 |
Figure 22. Observed magnetic fields in the interstellar cloudlets S106-IR and S106-FIR, as seen at the JCMT near 800 µm (adapted from Holland et al. 1996). The two circles represent the JCMT beams of 13.5". The units in x and y axes are in arcsec, with the (0,0) at RA = 20h 25m 34.3s, Dec = + 37° 12' 50.0". Two bars represent the magnetic field lines, which are roughly parallel to the major axis of the cloudlet. At 600 pc away, 1 arcmin corresponds to 0.2 pc. |
Figure 23 shows the area around the cloudlet MonR2, with sources IRS2 and IRS3, from 800 microns data (adapted from Greaves et al. 1995a). Here the magnetic field lines at first glance may appear to be roughly perpendicular to the overall major axis of the cloudlet (B poloidal). A detailed view shows that the magnetic field lines enter from the left, bend in the central area as measured at the telescope (circles), and exit at top right. Outside of the cloudlet, the polarization of field stars was taken from Hodapp (1987). It is interesting that a group of protostars has formed near the bend/gradient in the magnetic field - perhaps the details of the gravitational collapse process may affect how many protostars can form. Yao et al. (1997) refer to this magnetic structure as having an 'hourglass' morphology, because on the cloud scale the magnetic field seems to be oriented along the twin gas outflows (blue lobe 2'NW, red lobe 2' SE), and because on the small scale they see a tight pinching of the magnetic field near the IRS1/IRS2 starforming areas due to a supercritical collapse of a part of the the original cloud.
 |
Figure 23. Observed magnetic field lines in the interstellar cloudlet MonR2, as seen at he JCMT near 800 µm (adapted from Greaves et al. 1995c). Dashes represent the magnetic field lines, which very roughly follow the minor axis, but are seen in detail to bend near the cloudlet centre. The units in x and y axes are in arcsec, with (0,0) at RA = 06h 05m 19.8s, and Dec = - 06° 22'40.7". At 950 pc away, 1 arcmin corresponds to 0.3 pc. |
Aitken et al. (1997) proposed both a poloidal magnetic field for the elongated cloudlet OMC-1 at 450 pc with size ~ 80" (0.17 pc), as well as a toroidal magnetic field for an embedded core/disk with size ~ 5" (0.01 pc).
From the limited number of Extreme IR polarimetric maps available for cloudlets/protostellar disks, there is no clear preference in favour of any of the proposed theoretical models, and all the potential percentage correlations and angle corrrelations still remain to be rigorously proven.