Copyright © 1980 by Annual Reviews. All rights reserved
| Annu. Rev. Astron. Astrophys. 1980. 18:
489-535 Copyright © 1980 by Annual Reviews. All rights reserved |


(e) Galactic Background Contribution
The next "atmosphere" is the solar system and the galaxy, the "molecules" being the astrophysical phenomena distinguished by their spectra and identified by their anisotropic distribution. The individual "molecules" are not indistinguishable and can only be characterized in a statistical sense. As a consequence, the success in modeling the "local" astrophysical background depends heavily on sampling much of the sky with extended spectral coverage.
Figure 3 shows the present best estimates of known astrophysical sources that emit in the frequency range important to CBR measurements. The CBR lies predominantly in a clear region of the local astrophysical spectrum embraced by synchrotron emission of cosmic ray electrons moving in galactic magnetic fields and free-free thermal emission by ionized gas surrounding hot stars (H II regions) at low frequencies and by the thermal emission of interstellar dust at high frequencies.
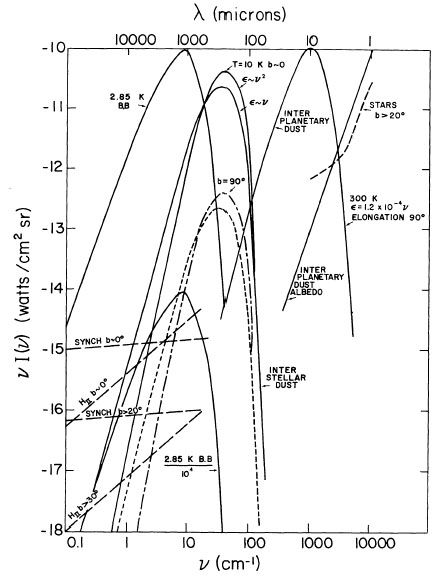 |
Figure 3. The astrophysical background. |
Full sky maps of synchrotron emission have been made at low
frequencies, 200 MHz
(Droge & Priester 1956)
and 404 MHz
(Pauliny-Toth &
Shakeshaft 1962),
where it is the major source of the galactic background
and pervades the sky. There is no region of the sky which emits less than
~ 5% of the strongest sources contained in the galactic plane in a
band b ± 10°, l ± 40°. The spectral
index n, defined by
I( )
)
 -n, ranges between
0.8 to 0.9
(Witebsky 1975)
as determined by high frequency measurements
in selected regions of the sky. The spectral index depends on the energy
distribution of the radiating electrons and may well be different in
discrete sources such as supernova remnants and in the general galactic
background. In clearer regions, toward the galactic poles, the antenna
temperature due to synchrotron emission is approximated by
-n, ranges between
0.8 to 0.9
(Witebsky 1975)
as determined by high frequency measurements
in selected regions of the sky. The spectral index depends on the energy
distribution of the radiating electrons and may well be different in
discrete sources such as supernova remnants and in the general galactic
background. In clearer regions, toward the galactic poles, the antenna
temperature due to synchrotron emission is approximated by
 |
Strong H II regions lie primarily in the galactic plane although the
Orion nebula is a notable exception. A compilation of emission by H II
regions at 5 GHz is given by
Lang (1978),
from data of
Reifenstein et al. (1970)
and Wilson et al. (1970).
A proper estimate of the contribution from
discrete H II source emission requires knowledge of the specific H II
regions in the observing beam. Typical parameters for the stronger H II
regions are electron temperatures ~ 7000 K, emission measure,
Ne2 d, ~ 106
electron2 × parsec per cm6, and angular size,
 S, ~
0.1°. In the spectral region of interest to CBR measurements, 1 GHz
< f < 1000 GHz, quantum
effects are negligible, and the optical depth in the source is much less
than unity. The spectrum is almost flat, modified only by the classical
Gaunt factor, giving a spectral index of approximately 0.1. The antenna
temperature
of such a typical H II region, when diluted in a beam of angular size
B ~ 10°,
is given by
(Lang 1978)
S, ~
0.1°. In the spectral region of interest to CBR measurements, 1 GHz
< f < 1000 GHz, quantum
effects are negligible, and the optical depth in the source is much less
than unity. The spectrum is almost flat, modified only by the classical
Gaunt factor, giving a spectral index of approximately 0.1. The antenna
temperature
of such a typical H II region, when diluted in a beam of angular size
B ~ 10°,
is given by
(Lang 1978)
 |
(9) |
In addition to the discrete H II regions, Hirabayashi (1974) has observed a diffuse galactic background ascribed to free-free emission with an emission measure of 4000 pc cm-6 and an average electron temperature of 3000 K, directly in the galactic plane. Combining this observation with the model proposed by Ellis & Hamilton (1966), which assumes the ionized hydrogen is distributed uniformly (Ne ~ 0.2 cm-3) in a disk 300 pc thick on either side of the plane, gives the following estimated antenna temperature (Smoot 1977) using Equation (9):
 |
The estimates for thermal emission by interstellar dust gains shown in
Figure 3 are merely suggestive since both the
physical properties of the
dust grains as well as the dust distribution throughout the Galaxy are
still poorly known. Direct measurements of interstellar dust emission in
the far infrared, < 50
cm-1, have been made solely in regions of strong emission
such as in surveys of the galactic plane - at 50 cm-1
(Low et al. 1977),
at 20 and 10 cm-1
(Owens et al. 1979)
- and observations toward the galactic center at 28 cm-1
(Gezari et al. 1973
and Rieke et al. 1973),
and at 18 cm-1
(Hildebrand et al. 1978).
It has proved difficult to determine the spectrum by
comparing measurements of the same objects made by instruments using
different beam widths and spatial chopping techniques because many of the
dusty regions are complex with both compact and diffuse emitting regions.
For
 50 cm-1, the
radiating efficiency of the gains is small since the
wavelength is much larger than the gain dimensions, assumed
10-5 cm and smaller, so that even for the densest regions of
the Galaxy the optical depth at
< 50 cm-1 is
less than 1. The emittance of a dust column is then
50 cm-1, the
radiating efficiency of the gains is small since the
wavelength is much larger than the gain dimensions, assumed
10-5 cm and smaller, so that even for the densest regions of
the Galaxy the optical depth at
< 50 cm-1 is
less than 1. The emittance of a dust column is then
 |
(10) |
where  a2 is
a typical cross sectional area of the gain, NB, the
column density of grains,
B(,
TD) the blackbody emittance at the dust temperature
TD, and
Qabs() the
emissivity per grain.
a2 is
a typical cross sectional area of the gain, NB, the
column density of grains,
B(,
TD) the blackbody emittance at the dust temperature
TD, and
Qabs() the
emissivity per grain.
The most general form of the emissivity per gain is
 |
(11) |
where f () is a
function of the imaginary part of the gain dielectric constant.
The observations in strongly emitting regions indicate that f
() varies as
0.5 to
2 and implies that
the far infrared emission is most likely due to the
low frequency tails of solid state absorption bands in the grains
(Aannestad 1975).
Combining Equations 10 and 11, the dust brightness is proportional to the volume of dust and therefore to the mass column density. The dust brightness alone, however, cannot give the gain emissivities because the mass column density is not known directly. In lieu of a dust model, estimates of the dust mass column densities are made from the observed correlation of dust with neutral gas. The dust column densities, estimated by optical extinction and reddening, related to H I column densities determined from 21 cm line profiles (see for example Knapp & Kerr 1974) indicate that the dust-to-hydrogen mass ratio is of the order of 1%.
In the past few years observation of CO emission in dusty regions, where it is a minor constituent, have provided estimates of the H2 densities, the major constituent. These measurements main give dust-to-neutral-gas ratios of ~ 1% (Scoville & Solomon 1975) and furthermore yield independent measurements of the dust temperature.
Along the galactic plane
|l | < 50°, plausible parameters that fit the
measured emission are TD ~ 25 K, dust mass column
density 3 × 10⁻⁴ gm / cm2,
corresponding to 2 × 10²² gas atoms / cm2,
individual grain emissivity
2 × 10⁻⁷(
cm-1)2, a = 10-5 cm, and a grain
density of 2 gm / cm3. These
are the parameters used in estimating the emission at b = 0 in
Figure 3 in a beam width of 16°, the
galactic plane filling about 1/15
of the beam. (2)
The estimates of dust emission out of the plane, especially toward the
galactic poles, are even more uncertain. The steps involved in the estimate
are the following: the dust type is assumed to be the same out of the
plane as
in the plane, the temperature of the dust is calculated on the basis of
radiative equilibrium with the absorption of star light
TD ~ 10 K, the dust
mass column density is estimated from H I column densities, and extinction
and reddening data
(Heiles & Jenkins 1976,
Daltabuit & Meyer
1972).
Various methods of calculating the dust mass density toward the galactic
poles do not agree. Reddening data of
Feltz (1972)
gives an extinction due to dust of 0.000 ± 0.006 map while
Appenzeller (1975)
infers an extinction
 0.03 from stellar
polarization due to dust grain alignment. The assumed
ratio of gas density to visual extinction is 1.6 × 10²¹
atoms / cm2 / mag or ~ 2.5 × 10⁻⁵ gm dust /
cm2 / mag so that the dust column density
to the galactic poles from extinction data is close to zero or larger than
7.5 × 10⁻⁷ gm / cm2(4 × 10¹⁹
atoms / cm2), while H column densities are
measured directly as 1 - 2 × 10²⁰ atoms /
cm2. The dust mass column density adopted for
Figure 3 is 8 × 10⁻⁷ gm /
cm2, at
b = 90°, and to the same precision as any of these estimates,
may follow a cosecant law with galactic latitude.
0.03 from stellar
polarization due to dust grain alignment. The assumed
ratio of gas density to visual extinction is 1.6 × 10²¹
atoms / cm2 / mag or ~ 2.5 × 10⁻⁵ gm dust /
cm2 / mag so that the dust column density
to the galactic poles from extinction data is close to zero or larger than
7.5 × 10⁻⁷ gm / cm2(4 × 10¹⁹
atoms / cm2), while H column densities are
measured directly as 1 - 2 × 10²⁰ atoms /
cm2. The dust mass column density adopted for
Figure 3 is 8 × 10⁻⁷ gm /
cm2, at
b = 90°, and to the same precision as any of these estimates,
may follow a cosecant law with galactic latitude.
2 The dust model isn't totally crazy;
using sample
Lorentz-Lorenz theory with one resonance, the emissivity per grain is
(2/3)( /
mrma)(are)(2
/
mrma)(are)(2
 /
04)
where ma is the mass per atom,
assuming each atom contributes one oscillator, re the
Thomson radius of the electron, and
0
the resonance frequency in cm-1 with width
. Assuming
~ 1/10
0,
0 ~ 1000
cm-1,
typical of silicates and carbonates, the emissivity/grain is of the same
order of magnitude as used above.
Back.
/
04)
where ma is the mass per atom,
assuming each atom contributes one oscillator, re the
Thomson radius of the electron, and
0
the resonance frequency in cm-1 with width
. Assuming
~ 1/10
0,
0 ~ 1000
cm-1,
typical of silicates and carbonates, the emissivity/grain is of the same
order of magnitude as used above.
Back.