


3.2. The evolution of morphologically-disturbed galaxies
With the advent of relatively wide-area, high spatial resolution and S/N imaging from HST, it has become feasible to search for galaxy interactions by identifying morphologically-disturbed galaxies. There are a number of ways in which one can evaluate morphological disturbance: a few examples are by visual inspection (e.g., [Arp (1966)]), residual structures in unsharp-masked or model-subtracted images (e.g., [Schweizer & Seitzer (1992)]), automated measures of galaxy asymmetry (e.g., [Conselice et al. (2000)]), or by the distribution of pixel brightnesses and 2nd-order moment of the light distribution (e.g., [Lotz, Primack, & Madau (2004)]).
The important hallmarks that these different methodologies probe are the non-equilibrium signatures of tidal interaction - multiple nuclei and extended tidal tails. These features are common in simulations of interacting galaxies, and cannot result from quiescent secular evolution (e.g., [Toomre & Toomre (1972)], [Barnes & Hernquist (1996)]). Visual inspection is a subjective way to pick out these structures, even to relatively low surface brightness limits; in contrast, automated measures of morphology typically quantify the amount of light in bright asymmetric structures, so pick out multiple bright patches or bright tidal tails rather effectively.
Recently,
[Conselice et al. (2003)]
have explored the fraction of galaxies with strong asymmetries in the
rest-frame B-band our to redshift ~ 3 in the Hubble Deep Field
North. Their results, for a similar absolute magnitude range as explored by
[Patton et al. (2002)]
and [Le Fèvre et al. (2000)],
are shown in Fig. 4. While small number
statistics (there are less than 500 galaxies contributing to the
fractions), coupled with asymmetry uncertainties, are clearly
an issue, a broadly consistent picture is painted whereby
galaxy mergers were substantially more frequent at
z  1,
and have decreased in frequency until the present day. It is
interesting to note that the observations are not well-reproduced
by the Benson et al. or van Kampen et al. models, which both
predict substantially lower merger rates. Indeed, perhaps for
the first time, observers are invoking the need for many more
mergers than theorists!
1,
and have decreased in frequency until the present day. It is
interesting to note that the observations are not well-reproduced
by the Benson et al. or van Kampen et al. models, which both
predict substantially lower merger rates. Indeed, perhaps for
the first time, observers are invoking the need for many more
mergers than theorists!
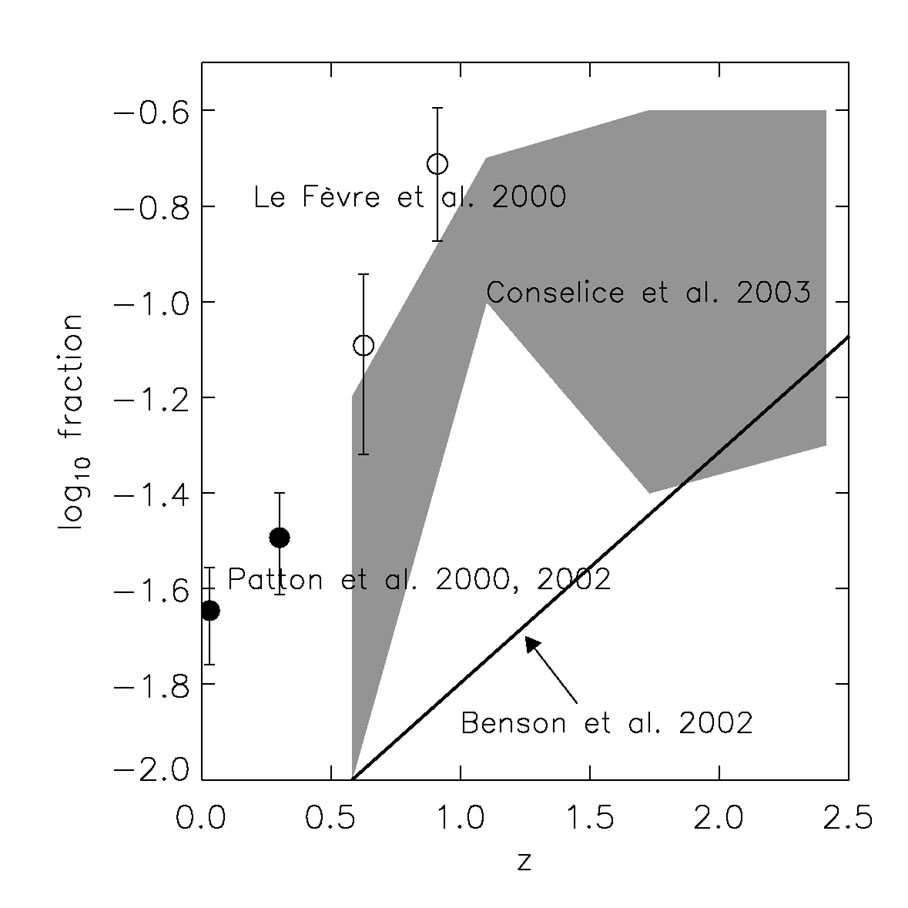 |
Figure 4. The evolution of merger rate as inferred from the fraction of galaxies with gross asymmetries ([Conselice et al. (2003)]; grey shaded region). Inferred merger rates from close pairs are reproduced from Fig. 3 for comparison. A rough fit to predictions of major merger rate (visible for 1 Gyr) from the semi-analytic galaxy formation model of [Benson et al. (2002)], reproduced from [Conselice et al. (2003)], is shown by the solid line for reference. |
While these first tentative steps are encouraging, there are a number of systematic uncertainties that should be considered carefully. At some level, contamination from projected close galaxy pairs is bound to be a problem. Samples of highly asymmetric galaxies will, correctly, include also some very close physically-associated galaxy pairs. Unfortunately, they will also contain a number of physically-unassociated close galaxy pairs: [Le Fèvre et al. (2000)] find that only ~ 30% of close galaxy pairs are likely to be physically-associated (in the sense of being in the same galaxy group; a smaller fraction still are genuine close pairs), and the mock COMBO-17 catalog analysis presented earlier suggests a fraction closer to 10%. These contaminants may be weeded out by source extraction software, as the pair of galaxy images may be parsed into 2 separate galaxies, each of which has a low asymmetry. Yet, if this image parsing is too enthusiastic, genuine major interactions may be parsed into multiple, individually rather symmetric, sub-units.
Furthermore, there are disagreements between different classification
methods as to what constitutes a `merger'. To this effect, I present
an example from the GEMS (Galaxy Evolution from Morphology and SEDs;
[Rix et al. (2004)])
HST survey of 1/4 square degree,
which is from work in preparation (being led by Shardha Jogee,
Christian Wolf, Dan McIntosh and myself), and is being used with
their permission.
Fig. 5 shows the correlation between
visually-classified galaxy type and automatically
measured concentration (C) and asymmetry measures
(A), measured using the same software as used by
[Conselice et al. (2003)]
- the CAS code. It is important to note that
the source extraction or CAS setups have not yet been optimized,
which may affect the results shown here. Shown are
rest-frame V-band values of C and A for galaxies with
0.65  z < 0.75
taken from GEMS. Visual morphologies are described by
[Bell et al. (2004a)]
and Wolf et al. (in prep.) in more detail
1.
Concentration correlates with morphological type: C(E/S0/Sa)
C(everything
else), with some inevitable scatter.
This trend was observed for this sample using an independent
measure of light profile concentration
([Bell et al. (2004a)])
2.
In contrast, asymmetry only very broadly correlates
with visual class. Galaxies of any type can have low
asymmetry, and indeed, galaxies of any type can have
high asymmetry (not just the galaxies which were visually identified
as peculiar and/or interacting).
Automated and visual measures of morphological disturbance
do not correlate especially well: factors may include
clumpy light distributions in lower-luminosity irregular but non-interacting
galaxies, or faint tidal tails in early- or late-stage mergers (i.e.,
the timescale probed by visual classifications may be longer than
for automated schemes). Yet, until these discrepancies are
understood, it will be difficult to claim that one has robustly
and uniquely measured merger
fraction from morphological information.
z < 0.75
taken from GEMS. Visual morphologies are described by
[Bell et al. (2004a)]
and Wolf et al. (in prep.) in more detail
1.
Concentration correlates with morphological type: C(E/S0/Sa)
C(everything
else), with some inevitable scatter.
This trend was observed for this sample using an independent
measure of light profile concentration
([Bell et al. (2004a)])
2.
In contrast, asymmetry only very broadly correlates
with visual class. Galaxies of any type can have low
asymmetry, and indeed, galaxies of any type can have
high asymmetry (not just the galaxies which were visually identified
as peculiar and/or interacting).
Automated and visual measures of morphological disturbance
do not correlate especially well: factors may include
clumpy light distributions in lower-luminosity irregular but non-interacting
galaxies, or faint tidal tails in early- or late-stage mergers (i.e.,
the timescale probed by visual classifications may be longer than
for automated schemes). Yet, until these discrepancies are
understood, it will be difficult to claim that one has robustly
and uniquely measured merger
fraction from morphological information.
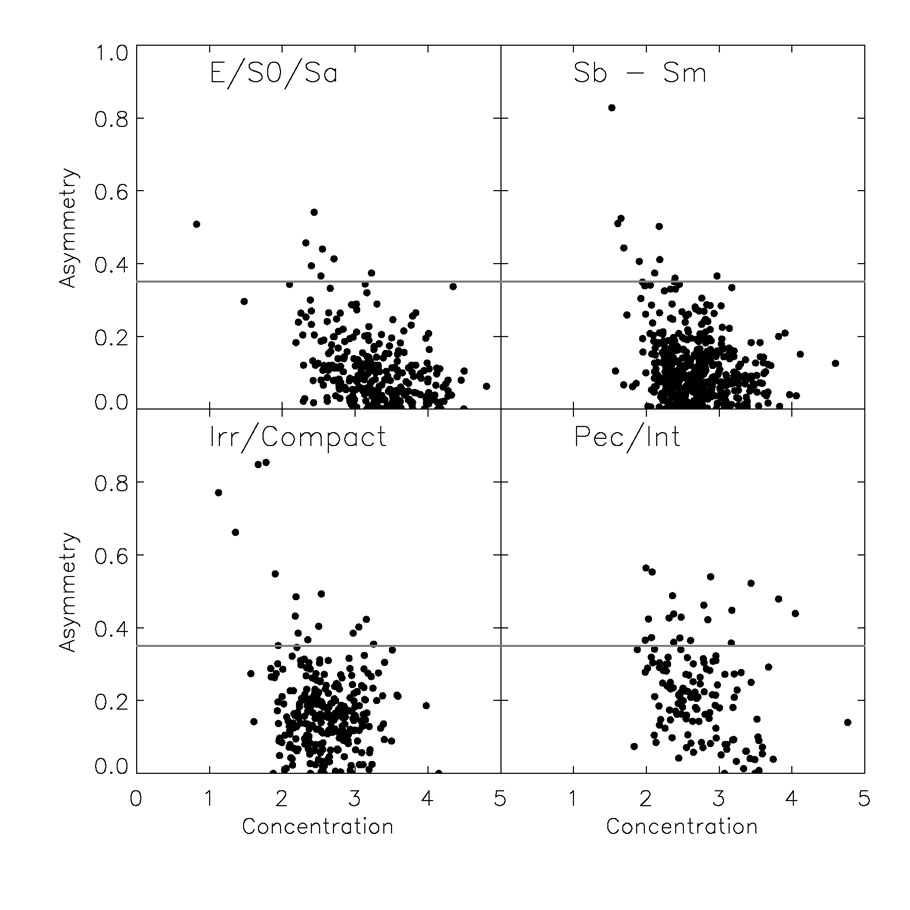 |
Figure 5. A comparison of visual morphology
and a measure of light concentration and asymmetry. A sample of
1414 galaxies with F850LP ACS imaging from the HST GEMS survey with
0.65 |
This discussion is by no means meant to detract from the value of the intriguing and ground-breaking work on merger rates from morphology; rather it is to emphasize that the measurement of merger rate is a subtle and difficult endeavor, fraught with systematic uncertainties which will likely have to be modeled explicitly using future generations of N-body, semi-analytic and SPH simulations, coupled with the artificial redshifting experiments already commonly used in this type of work.
1 Three independent classifiers have visually typed galaxies in this redshift range: myself, Dan McIntosh and Christian Wolf. Fig. 5 shows morphologies as assigned by myself, but using classifications from Christian Wolf or Dan McIntosh, or indeed a random combination of all three, does not change the conclusions. Back.
2 They adopted
the Sérsic index n to describe light concentration, where
the surface brightness profile
 as a function of radius
r is described by:
as a function of radius
r is described by:
 e-r1/n, where n = 1 corresponds to
an exponential light distribution, and
n = 4 corresponds to the well-known de Vaucouleurs profile.
Back.
e-r1/n, where n = 1 corresponds to
an exponential light distribution, and
n = 4 corresponds to the well-known de Vaucouleurs profile.
Back.