


According to the so-called AGN unified model (Antonucci 1993), Seyfert II galaxies are powered by the same engine (a supermassive black hole plus an accretion disk) as Seyfert I galaxies, but they are viewed through a geometrically and optically thick structure of gas and dust with an axisymmetric geometry (known as the "torus") that absorbs the nuclear radiation at ultraviolet (UV)/optical and soft X-ray energies. The distinction between type I and type II galaxies originally was conceived to classify objects characterized by different properties at UV and optical wavelengths. Both broad and narrow lines are visible over a strong blue UV-optical continuum in type 1 galaxies, while only narrow lines are observed in type 2 galaxies.
In the simplest version of the unified models, X-ray obscured sources are expected to be uniquely associated with optical type II sources. The increasing evidence of a mismatch between optical and X-ray classification (which will be discussed in the following sections) suggests that the terms type I and type II should be treated with caution and should always be referenced to a specific band. Following Matt (2002), in this review, I will use the original meaning of type II and type I, which is based on optical spectroscopy.
The amount of obscuring material can be measured best in the hard (2 - 10 keV) X-ray band, which is transparent up to column densities of order 1024 cm-2 (i.e., Compton thin); hence, hard X-ray surveys are a powerful method to obtain large, unbiased samples of obscured AGN. Since the first observations, it has been realized that the large majority of Seyfert II galaxies contain obscured AGN, which are fairly strong X-ray sources with 2 - 10 keV luminosities up to 1044 ergs s-1.
The relative fraction of sources with a given column density depends on the survey sensitivity at high energies and on the amount of obscuring gas. The larger the column density, and/or the lower the sensitivity, the stronger will be the observational bias against the discovery and identification of obscured AGN. Such a bias is maximal for (mildly) Compton thick sources due to the rapidly decreasing effective area at high energies of the most sensitive space observatories (the Chandra and XMM-Newton X-ray Observatories). Thus, we cannot measure the photoelectric cut-off and the corresponding NH value. Moreover, even observations in the hard X-ray domain above 10 keV do not allow the sampling of column densities of order 1025 cm-2 or larger because the entire high energy spectrum is down-scattered by Compton recoil to lower energies, where it is readily absorbed (see Fig. 1). The high energy spectra of obscured AGN are often much more complex than a single absorbed power law. Additional components (i.e., thermal emission from a starbursting region and/or nuclear flux scattered into the line of sight) are common in the X-ray spectra below 10 keV of several nearby Compton thick galaxies (Matt et al. 1997; Vignati et al. 1999). The photoelectric cut-off (if any) does not provide a measure of the "true" nuclear absorption anymore.
 |
Figure 1. Effects of photoelectric
absorption and Compton down-scattering on the typical AGN X-ray
spectrum (a power law with photon index
|
A powerful diagnostic of the presence of obscuring, possibly Compton thick, matter is provided by the intensity of the iron line, which is expected to be produced both by transmission through (Leahy & Creighton 1993) and/or reflection by absorbing gas (Ghisellini, Haardt, & Matt 1994; Matt, Brandt, & Fabian 1996).
As far as the transmitted continuum is concerned, the line equivalent width (EW) increases with the column density (since it is measured against an absorbed continuum) and reaches values of order 1 keV for NH ~ 1024 cm-2. Larger values for the EW (up to several keV) can be obtained for high inclination angles and small torus opening angles (Levenson et al. 2002).
The signature of Compton thick matter is also imprinted on the "reflected" light, the so-called "Compton reflection" continuum characterized by a broad bump peaking around 20 - 30 keV, which rapidly decreases at both low and high energies due to absorption and Compton down-scattering, respectively. In the 2 - 10 keV range, it is well approximated by a flat power law. The iron line EW with respect to the reflected continuum is always greater than 1 keV (George & Fabian 1991; Matt, Perola, & Piro 1991).
The shape of the reflection spectrum (reported in Fig. 2 for two specific examples) is also a function of the column density, the ionization status, and the metallicity of the reflecting matter (Matt 2002). Its intensity depends upon the solid angle subtended by the reflector at the primary illuminating source. The gas is more reflective if highly ionized, and the effect is significant at energies below 7 - 8 keV.
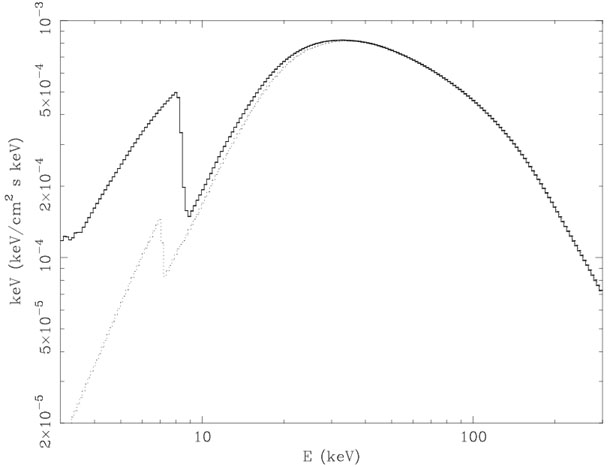 |
Figure 2. Spectrum reflected by Compton thick gas. Dotted curve corresponds to neutral gas; solid curve corresponds to highly ionized material. |
Despite the presence of other spectral components, such as thermal emission from a hot plasma with a range of temperatures, and/or scattered nuclear light that may dilute the typical reflection spectrum, the signature of Compton thick matter (i.e., a strong iron K line) has been unambiguously revealed already with the ASCA satellite in several nearby bright objects (i.e., the Circinus galaxy, Matt et al. 1996; NGC 6240, Iwasawa & Comastri 1998).
Within the framework of the unified scheme, a further method for evaluating NH has been proposed by Bassani et al. (1999). For a heterogeneous but sizable sample of Seyfert II galaxies, they found that the ratio between the 2 - 10 keV and the dereddened [OIII] flux (assumed to be an isotropic indicator of the intrinsic luminosity) is anti-correlated with the absorption column density and the EW of the iron line. Such a relationship could be used to select candidate Compton thick AGN, especially among those weak sources for which X-ray spectroscopy is not feasible. In this regard, it is interesting to note that the Seyfert II galaxy NGC 5135, characterized by a very low value of FX / F[OIII] and suspected to be Compton thick, is now unambiguously classified as such, thanks to the detection of a strong iron line in the Chandra spectrum (Levenson et al. 2004).
A significant step forward in the study of highly obscured AGN has been made with the Phoswich Detector System (PDS) instrument onboard BeppoSAX, which made accessible, for the first time, the 10 - 100 keV energy range down to limiting fluxes of order 10-11 ergs cm-2 s-1. Deep exposures of a sample of seven nearby, bright objects selected by the presence of the characteristic features described above allowed the intrinsic nuclear spectrum above 10 keV to be unambiguously uncovered in 5 out of the 7 sources, and column densities in the range 1 - 5 × 1024 cm-2 to be measured (see Matt et al. 2000 for a review).
The issue of how common Compton thick sources are and whether they constitute a sizable fraction of the Seyfert population has been addressed by Maiolino et al. (1998) and Risaliti et al. (1999a). Starting from a sample of local Seyfert II galaxies selected on the basis of their [OIII] flux, and using ASCA and BeppoSAX observations, they concluded that about half of the objects are obscured by column densities NH > 1024 cm-2. Given the lack of complete spectral coverage at energies > 10 keV with BeppoSAX, the relative fraction of heavily (NH > 1025 cm-2) and mildly (1024 < NH < 1025 cm-2) Compton thick sources remained poorly constrained.
Several independent arguments suggest that the space density of
Compton thick sources, at least in the local universe, could be high.
For example, two out of the three nearest AGN within 4 Mpc
are mildly Compton thick (NGC 4945 and Circinus; the third source,
Cen A, is also obscured with
NH  1023 cm-2).
A simple estimate obtained by integrating the AGN luminosity
function indicates that heavily obscured AGN could outnumber
unobscured AGN by about one order of magnitude (see
Matt et al. 2000
for a detailed discussion).
1023 cm-2).
A simple estimate obtained by integrating the AGN luminosity
function indicates that heavily obscured AGN could outnumber
unobscured AGN by about one order of magnitude (see
Matt et al. 2000
for a detailed discussion).
The optical appearance of Compton thick AGN may also contribute to raising the estimate of their space density. Indeed, two bright objects (NGC 4945 and NGC 6240) are classified as LINERs (Low Ionization Nuclear Emission Regions) on the basis of their optical spectra and, as a consequence, have not been included in the sample of Risaliti et al. (1999a). The detection of Compton thick matter in objects with broad optical emission lines (type I; Guainazzi, Stanghellini, & Grandi 2003; Iwasawa, Maloney, & Fabian 2002) highlights the uncertainties associated with the estimates of the occurrence of Compton thick absorption. More examples of AGN that do not show any Seyfert signatures in the optical band have been reported recently by Maiolino et al. (2003): Chandra observations of a small sample of this class of optically "elusive" nuclei indicate that most of them are obscured by column densities exceeding 1024 cm-2. Their space density is comparable or even higher than that of optically selected Seyfert nuclei, implying that the ratio between obscured and unobscured AGN is larger than previously estimated.
It is also worth mentioning that high amplitude variability may play an important role in the source classification. Several convincing examples have been discussed by Matt, Guainazzi, & Maiolino (2003) where a transition from a reflection dominated spectrum to Compton thin and vice versa has been detected on timescales of order a few years. The most likely explanation entails strong variability of the continuum nuclear source and a Compton thick reflector on the parsec scale, possibly associated with the absorbing torus. If the nuclear source is switched off, only the reflected light is detected. Conversely, if the primary continuum source is switched on, the reflected component is not dominant anymore. Although such an effect should not change, on average, the relative ratio between Compton thick and Compton thin absorbers, it adds further uncertainties in the estimates of the absorption distribution and may also explain the mismatches between optical and X-ray classifications if the observations at different wavelengths are not simultaneous.
On the basis of what has been discussed above, it is concluded that Compton thick absorption is quite common among Seyfert galaxies in the local universe. Several independent lines of evidence suggest that mildly and heavily Compton thick sources are likely to dominate the absorption distribution observed in nearby AGN. The covering factor of the Compton thick gas must therefore be large.
A compilation of column densities in the Compton thick regime collected from the literature is reported in Table 1 for objects observed above 10 keV with BeppoSAX. The Compton thick nature of sources observed below 10 keV, inferred from the presence of a strong iron line, is reported in Table 2. Due to the lack of coverage above 10 keV, only a conservative lower limit could be placed on the intrinsic column density.
| Source Name | Opt. Class. | z | NH | L2-10 keV | Ref. |
| (1024 cm-2) | (1044 ergs s-1) | ||||
| NGC 1068 | Sy2 | 0.0038 |  10 10 |
> 1 | (1,2) |
| Circinus | Sy2 | 0.0014 | 4.3 | 0.01 | (2,3) |
| NGC 6240 | LINER | 0.0243 | 2.2 | 1.2 | (4) |
| Mrk 3 | Sy2 | 0.0134 | 1.1 | 0.9 | (5,6) |
| NGC 7674 | Sy2 | 0.0289 | 10 |
2 | (7) |
| NGC 4945 | LINER | 0.0019 | 2.2a | 0.03 | (8) |
| Tol 0109-383 | Sy2b | 0.0116 | 2.0 | 0.2 | (9) |
| IRAS 09104+4109 | QSO2c | 0.442 |
5d |
80 | (10) |
| NGC 3690 | HII | 0.011 | 2.5 | 0.2 | (11) |
| NGC 3281 | Sy2 | 0.0115 | 2.0 | 0.23 | (12) |
| M 51 | LINER/Sy2 | 0.0015 | 5.6 | 0.0011 | (13) |
| NGC 3079 | LINER/Sy2 | 0.0038 | 10 | 0.01-0.1 | (14) |
| S5 1946+708 | RadioGal | 0.101 | > 2.8 | > 36 | (15) |
| PKS 1934-63 | RadioGal | 0.182 | >1 | > 1.9 | (15) |
| IRAS 20210+1121 | Sy2 | 0.0564 | > 10 | 0.022 | (16) |
| IC 3639 | Sy2 | 0.0110 | > 10 | 0.09 | (17) |
| NGC 1386 | Sy2 | 0.0029 | > 1 | 0.04 | (18) |
| NGC 2273 | Sy2 | 0.0062 | > 10 | 0.08 | (18) |
| NGC 3393 | Sy2 | 0.0125 | > 10 | 0.1 | (18) |
| NGC 4939 | Sy2 | 0.0104 | > 10 | 0.3 | (18) |
| NGC 5643 | Sy2 | 0.0039 | > 10 | 0.045 | (18) |
| MCG-05-18-002 | Sy2 | 0.0056 | > 10 | 0.05 | (18) |
| IRAS 11058-1131 | Sy2 | 0.0548 | > 10 | 2.6 | (19) |
| Mrk 266 | Sy2 | 0.0279 | > 10 | 0.9 | (19) |
| IRAS 14454-4343 | Sy2 | 0.0386 | > 10 | 0.7 | (19) |
References - (1) Matt et al. 1997; (2) Guainazzi et al. 1999; (3) Matt et al. 1999; (4) Vignati et al. 1999; (5) Cappi et al. 1999; (6) Matt et al. 2000; (7) Malaguti et al. 1998; (8) Guainazzi et al. 2000; (9) Iwasawa et al. 2001; (10) Franceschini et al. 2000; (11) Della Ceca et al. 2002; (12) Vignali & Comastri 2002; (13) Fukazawa et al. 2001; (14) Iyomoto et al. 2001; (15) Risaliti, Woltjer, & Salvati 2003; (16) Ueno et al. 1998; (17) Risaliti et al. 1999b; (18) Maiolino et al. 1998; (19) Risaliti et al. 2000. |
|||||
Table notes - a In Schurch, Roberts, & Warwick (2002), ~ 4 using Chandra plus XMM-Newton observations. b See also Murayama, Taniguchi, & Iwasawa (1998) for a different optical classification. c Hyperluminous infrared galaxy with strong narrow emission lines (Kleinmann et al. 1988). d Iwasawa et al. (2001) find 3.3 using a Chandra observation. |
|||||
The majority of the sources are low redshift (z < 0.05), relatively low luminosity (LX < 1043 ergs s-1) Seyfert II galaxies. Several interesting exceptions, however, do exist and will be discussed in the next section. The 2 - 10 keV luminosities are corrected for intrinsic absorption assuming the best fit spectral parameters reported in the literature. It is important to point out that for high column densities, the intrinsic luminosity is strongly dependent upon the precise value of absorption. For this reason, the luminosities should be considered only indicative and subject to substantial uncertainties. This is even more true for those sources for which only a lower limit for the intrinsic column density is available. The 2 - 10 keV luminosity has been estimated assuming that 1% of the intrinsic luminosity is actually observed below 10 keV, due to scattering and or reflection. This assumption, though reasonable and supported by some observational evidence (Turner et al. 1997), is not always the rule for Compton thick sources. Although all efforts have been made to make the list as complete as possible, some objects could have been missed. Moreover, the sample is by no means complete and should not be used for statistical investigations.
| Source Name | Opt. Class. | z | NH | L2-10 keV | Ref. |
| (1024 cm-2) | (1044 ergs s-1) | ||||
| Mrk 1066 | Sy2 | 0.0121 | > 1 | 0.07 | (20) |
| NGC 5005 | Sy2/LINER | 0.0032 | > 1 | 0.0064 | (20) |
| NGC 5347 | Sy2 | 0.0078 | > 1 | 0.05 | (20) |
| IC 5135 | Sy2 | 0.0161 | > 1 | 0.3 | (20) |
| NGC 5135 | Sy2 | 0.0137 | > 1 | 0.075 | (21) |
| NGC 1667 | Sy2 | 0.0152 | > 1 | 0.01 | (21) |
| Mrk 1210 | Sy2 | 0.0135 | > 1 | 0.8 | (21) |
| Mrk 477 | Sy2/NLSy1 | 0.0378 | > 1 | 5 | (21) |
| ESO 138-G1 | Sy2 | 0.0091 | > 1.5 | 0.33 | (22) |
| OQ +208 | RL QSO | 0.077 | > 1 | 1.4 |
(23) |
| NGC 6552 | Sy2 | 0.0262 | > 1 | 1.2 | (24) |
| IC 2560e | Sy2 | 0.0097 | > 1f | 0.03 | (25) |
| NGC 2623 | LINER | 0.0185 | > 1 | 0.1 | (26) |
| NGC 4418 | LINER | 0.0073 | > 1 | 0.0016 | (26) |
| UGC 5101 | LINER | 0.0394 | > 1 | 0.2 | (27) |
| NGC 4968h | Sy2 | 0.0099 | > 1 ? | 0.15 | (28) |
| IRAS 19254-7245 | HII | 0.062 | 1 |
10 | (29) |
| IRAS F12514+1027 | QSO/Sy2 | 0.30 | > 1.5 | > 1.8 | (30) |
References - (20) Risaliti et al. 1999a; (21) Bassani et al. 1999; (22) Collinge & Brandt 2000; (23) Guainazzi et al. 2003; (24) Risaliti et al. 2000; (25) Iwasawa et al. 2002; (26) Maiolino et al. (2003); (27) Ptak et al. 2003. (28) Guainazzi et al. 2002; (29) Braito et al. 2003; (30) Wilman et al. 2003. |
|||||
Table notes -
e See also
Risaliti et al. (1999a)
for the BeppoSAX observation.
f From the iron
K |
|||||
 = 2, plus an
exponential cut-off at 300 keV).
Labels correspond to the logarithm of the column density.
= 2, plus an
exponential cut-off at 300 keV).
Labels correspond to the logarithm of the column density. line EW, find > 3.
h See also
Bassani et al. (
line EW, find > 3.
h See also
Bassani et al. (