


The amount of obscuring gas in Seyfert galaxies and quasars, and the distribution of column density as a function of redshift and luminosity, are key ingredients in the X-ray background synthesis models. First predicted by Setti & Woltjer (1989) and elaborated on with an increasing degree of detail by several authors (Madau, Ghisellini, & Fabian 1994; Comastri et al. 1995; Gilli, Salvati, & Hasinger 2001), the XRB spectral energy density is due to the integrated contribution of highly obscured AGN.
Although a detailed description of population synthesis models for
the XRB is beyond the purposes of the present chapter, it might be
useful to summarize briefly the main features (see
Comastri 2001
for more details). The basic recipe to "cook" the so-called baseline
model is a rather straightforward three-step approach.
(1) Assume as a template for unobscured (type I) sources the average
spectrum of nearby Seyfert I galaxies above 2 keV, parameterized as
a steep ( = 1.9)
power law plus a reflection component from
a face-on disk and a high energy cutoff at about 300 keV.
(2) Add to the template a distribution of column densities with
log NH in the range 21 - 25 cm-2 to model
the obscured
(type II) AGN population. (3) Fold both the type I and type II
spectra with an evolving X-ray luminosity function (XLF) with
best fit parameters determined from soft X-ray surveys and
appropriate for unobscured AGN.
= 1.9)
power law plus a reflection component from
a face-on disk and a high energy cutoff at about 300 keV.
(2) Add to the template a distribution of column densities with
log NH in the range 21 - 25 cm-2 to model
the obscured
(type II) AGN population. (3) Fold both the type I and type II
spectra with an evolving X-ray luminosity function (XLF) with
best fit parameters determined from soft X-ray surveys and
appropriate for unobscured AGN.
The column density distribution is varied in both shape and normalization until a good fit to the XRB spectrum, source counts in different energy bands, and redshift distributions at different limiting fluxes is obtained. While at first glance it seems that the only parameters that are free to vary are those related to the absorption distribution, it must be stressed that the best fit values adopted for the evolving XLF and spectral templates are also subject to non-negligible uncertainties that are not taken into account in the baseline model. In particular, the assumptions concerning the XLF evolution of the obscured population, though in line with a strict version of the AGN unified scheme, do not have any observational support. It is thus remarkable that a such a model was able to reproduce all of the observational constraints available in the pre-Chandra/XMM-Newton era. It is also worth remarking that the baseline model (as well as all of the models proposed so far) is purely X-ray based: the optical appearance of an obscured source may not necessarily be that of an optically selected type II AGN.
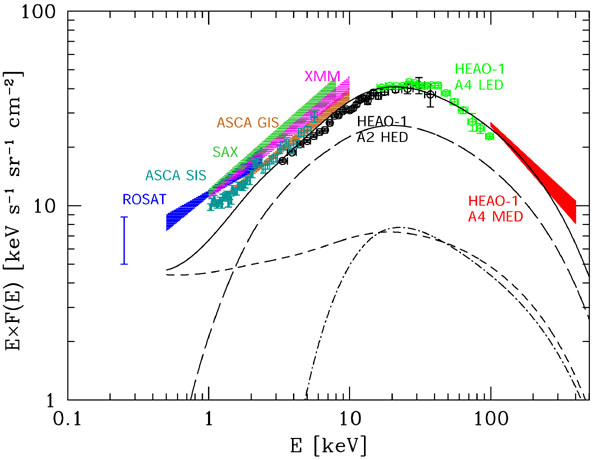
The integrated contributions of unobscured and obscured AGN, the latter split into Compton thin and Compton thick AGN, are reported in Figure 3 (adapted from Comastri et al. 2001). Even though such a model is not able to reproduce some of the recent observational constraints emerging from deep Chandra and XMM-Newton surveys - in particular, the observed redshift distribution - it can be considered representative of most of the population synthesis models, at least regarding the contribution of Compton thick sources to the broadband XRB spectrum (see, for example, Fig. 5 in Wilman & Fabian 1999). Indeed, in the synthesis model of Ueda et al. (2003), where a more satisfactory description of the recent observational constraints is obtained, the integrated contribution of mildly Compton thick sources is very similar to that shown in Figure 3.
 |
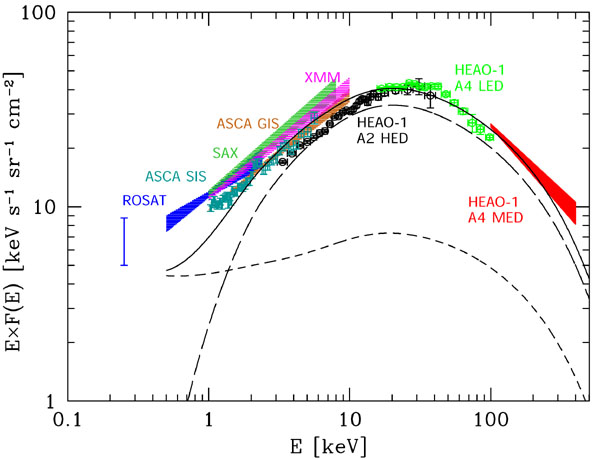 |
Figure 3. (Top panel) AGN contribution (solid line) to the XRB spectral energy density, as measured by different instruments (labeled). Contributions of unobscured (dashed line), Compton thin (long-dashed line), and Compton thick (dot-dashed line) AGN are also shown. Labels refer to XRB measurements obtained by different satellites. (Bottom panel) Same as above, but without Compton thick AGN. |
Not surprisingly, mildly Compton thick sources provide a non-negligible contribution only around the peak energy of the XRB spectrum, while it is clear that most of the energy density is accounted for by obscured, Compton thin AGN.
Given that the overall shapes of Compton thin and Compton thick AGN, once convolved with the evolving XLF, are very similar, it seems reasonable to argue that the XRB spectrum could be equally well fitted without invoking Compton thick absorption. Indeed, this appears to be the case: an acceptable fit to the XRB spectrum can be obtained just by rescaling the absorption distribution of Compton thin AGN (see Fig. 3).
However, the relative fraction of absorbed (NH > 1022 cm-2) sources as a function of the 2 - 10 keV flux is significantly overestimated over the entire range of fluxes (solid line in Fig. 4). While the model that includes Compton thick absorption does fit the observations at both very bright and faint fluxes better (dashed line in Fig. 4), the absorption distribution measured by shallow, large-area ASCA and XMM-Newton surveys is not well matched. Such a discrepancy, together with the redshift distribution of obscured AGN, is challenging the standard model for the XRB, at least in its simplest form, calling for some revision of the basic assumptions. A detailed comparison of XRB modeling versus observations is beyond the purposes of this chapter. The bottom line of the exercise described above is that Compton thick absorption cannot be neglected in building up a synthesis model for the XRB.
 |
Figure 4. Expected fraction of sources with absorption column densities larger than 1022 cm-2 vs. 2 - 10 keV flux for a model without (solid line) and with (dashed line) Compton thick sources. Points and associated error bars correspond to the observed fraction of absorbed sources in different X-ray surveys: open square at bright X-ray fluxes is from the HEAO1-A2 AGN sample of Piccinotti et al. (1982), open hexagon is from the ASCA Large Sky Survey (Akiyama et al. 2000), open triangles are from XMM-Newton observations (Piconcelli et al. 2002), and filled triangles are from Chandra observations (Brusa 2004). |
On the other hand, it is also possible to fit the XRB spectrum
with a model where the contribution of heavily Compton thick AGN
is dominant. This possibility has been put forward by
Fabian et al. (1990),
who showed that the 10 - 300 keV background
intensity can be accounted for by the integrated contribution of
luminous sources at <z> ~ 1.5 with the
characteristic Compton "reflection" spectrum
(see Fig. 2). The most interesting
feature of this model is the natural explanation of the XRB 30 keV peak in
terms of a physical process that is basically driven by the Thomson
cross-section,
 T. The
integrated spectrum of Compton
reflection dominated sources is, however, too hard and does not
fit the data below 10 keV; moreover, the source counts
in the 0.3 - 3.5 keV band (the only available at that time)
were strongly underestimated
(Comastri 1991;
Terasawa 1991).
T. The
integrated spectrum of Compton
reflection dominated sources is, however, too hard and does not
fit the data below 10 keV; moreover, the source counts
in the 0.3 - 3.5 keV band (the only available at that time)
were strongly underestimated
(Comastri 1991;
Terasawa 1991).
Although such an extreme hypothesis is ruled out by the data,
it has been pointed out that the 30 keV peak can be better
reproduced including a "reflection" component
(Gilli et al. 2001;
Ueda et al. 2003)
with a covering factor of about 2 (Fig. 5) in the spectral templates of both
unobscured and obscured AGN.
(Fig. 5) in the spectral templates of both
unobscured and obscured AGN.
 |
Figure 5. Long dashed curve is the X-ray
spectrum after reflection from cold thick matter subtending
2 |
On the basis of these considerations, it is safe to conclude that absorption and reflection from Compton thick matter need to be included in the high energy spectra of the sources responsible for the hard XRB. While there is compelling evidence (see Section 2) for a numerous population of Compton thick AGN in the nearby universe, their space density at cosmological distances is still basically unknown.