

It is convenient to express the mean densities
 i of
various quantities in the Universe in terms of their fractions relative
to the critical density:
i of
various quantities in the Universe in terms of their fractions relative
to the critical density:
 i
i
 i /
crit.
The theory of
cosmological inflation strongly suggests that the the total density should
be very close to the critical one:
tot
i /
crit.
The theory of
cosmological inflation strongly suggests that the the total density should
be very close to the critical one:
tot
 1, and this is
supported by the available data on the cosmic microwave background
radiation (CMB)
(Bond 2003).
The fluctuations observed in the CMB at a level
~ 10-5 in amplitude exhibit a peak at a partial wave
1, and this is
supported by the available data on the cosmic microwave background
radiation (CMB)
(Bond 2003).
The fluctuations observed in the CMB at a level
~ 10-5 in amplitude exhibit a peak at a partial wave
 ~ 200, as would be produced
by acoustic oscillations in a flat Universe with
tot
1. At lower partial waves,
<< 200, the CMB
fluctuations are believed to
be dominated by the Sachs-Wolfe effect due to the gravitational potential,
and more acoustic oscillations are expected at larger
> 200, whose
relative heights depend on the baryon density
b. At
even larger
~ 200, as would be produced
by acoustic oscillations in a flat Universe with
tot
1. At lower partial waves,
<< 200, the CMB
fluctuations are believed to
be dominated by the Sachs-Wolfe effect due to the gravitational potential,
and more acoustic oscillations are expected at larger
> 200, whose
relative heights depend on the baryon density
b. At
even larger
 1000, these
oscillations should be progressively damped away.
1000, these
oscillations should be progressively damped away.
Fig. 1 compares measurements of CMB fluctuations
made before WMAP
(Bond 2003)
with the WMAP data themselves
(Bennett et al.
2003;
Hinshaw et al.
2003),
that were released shortly after this Meeting.
The position of the first acoustic peak indeed corresponds to a flat
Universe with
tot
1: in particular, now
WMAP finds
tot =
1.02 ± 0.02
(Spergel et al.
2003),
and two more acoustic peaks are established with high significance,
providing a new determination of
b
h2 = 0.0224 ± 0.0009, where h ~ 0.7
is the present Hubble expansion rate H, measured in units of
100 km/s/Mpc. The likelihood functions for various cosmological
parameters are shown in Fig. 2. Remarkably,
there is excellent
consistency between the estimate of the present-day Hubble constant
H ~ 72 km/s/Mpc from WMAP
(Spergel et al.
2003)
with that inferred
from the local distance ladder based, e.g., on Cepheid variables.
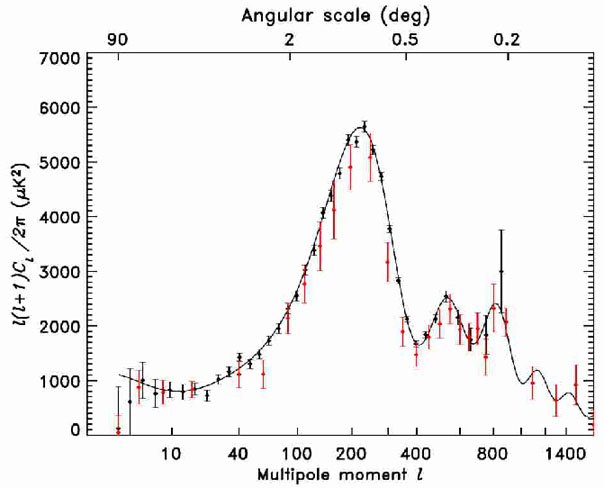 |
Figure 1. Spectrum of fluctuations in the
cosmic microwave background measured by WMAP (darker points with
smaller error bars), compared with previous
measurements (lighter points with larger error bars, extending to greater
|
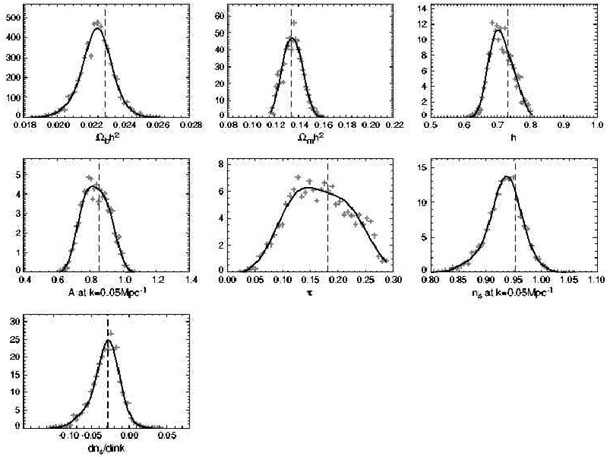 |
Figure 2. The likelihood functions for
various cosmological parameters obtained from the WMAP data analysis
(Spergel et al.
2003).
The panels show the baryon density
|
As seen in Fig 3, the combination of CMB data
with those on high-redshift Type-Ia supernovae
(Perlmutter 2003;
Perlmutter & Schmidt
2003)
and on large-scale structure
(Peacock 2003a,
b)
favour strongly a flat
Universe with about 30 % of (mainly dark) matter and 70 % of vacuum
(dark) energy. Type-Ia supernovae probe the geometry of the Universe at
redshifts z
 1. They
disagree with a flat
tot = 1
Universe that has no vacuum energy, and also with an open
m
0.3 Universe
(Perlmutter 2003;
Perlmutter & Schmidt
2003).
They appear to be adequate standard
candles, and two observed supernovae with z > 1 argue strongly
against
dust or evolution effects that would be sufficient to cloud their
geometrical interpretation. The supernovae indicate that the expansion of
the Universe is currently accelerating, though it had been decelerating
when z was > 1. There are good prospects for improving
substantially
the accuracy of the supernova data, by a combination of continued
ground-based and subsequent space observations using the SNAP satellite
project (Perlmutter 2003;
Perlmutter & Schmidt
2003).
1. They
disagree with a flat
tot = 1
Universe that has no vacuum energy, and also with an open
m
0.3 Universe
(Perlmutter 2003;
Perlmutter & Schmidt
2003).
They appear to be adequate standard
candles, and two observed supernovae with z > 1 argue strongly
against
dust or evolution effects that would be sufficient to cloud their
geometrical interpretation. The supernovae indicate that the expansion of
the Universe is currently accelerating, though it had been decelerating
when z was > 1. There are good prospects for improving
substantially
the accuracy of the supernova data, by a combination of continued
ground-based and subsequent space observations using the SNAP satellite
project (Perlmutter 2003;
Perlmutter & Schmidt
2003).
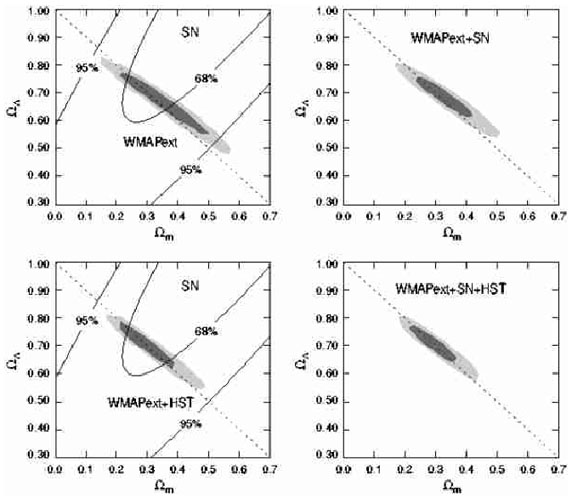 |
Figure 3. The density of matter
|
It is impressive that the baryon density inferred from WMAP data
(Spergel et al.
2003)
is in good agreement with the value calculated previously
on the basis of Big-Bang nucleosynthesis (BBN), which depends on
completely different (nuclear) physics. Fig. 4
compares the abundances of light elements calculated using the WMAP
value of b
h2 with those inferred from astrophysical data
(Cyburt et al.
2003).
Depending on the astrophysical assumptions that are made in extracting the
light-element abundances from astrophysical data, there is respectable
overlap.
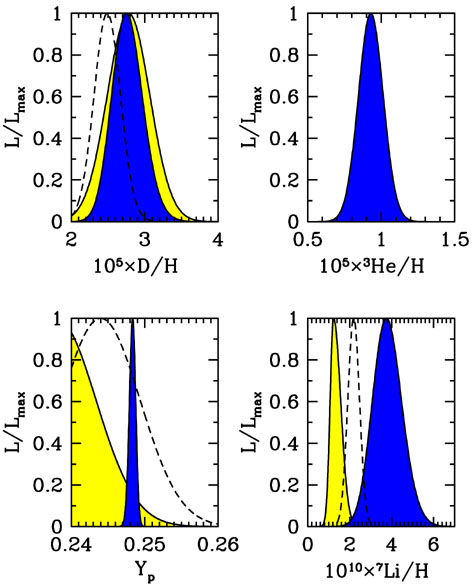 |
Figure 4. The likelihood functions for the
primordial abundances of light elements
inferred from astrophysical observations (lighter, yellow shaded regions)
compared with those calculated using the CMB value of
|
As we heard at this Meeting, several pillars of inflation theory have now
been verified by WMAP and other CMB data
(Bond 2003):
the Sachs-Wolfe effect due to fluctuations in the
large-scale gravitational potential were first seen by the COBE satellite,
the first acoustic peak was seen in the CMB spectrum at
~ 210
and this has been followed by two more peaks and the intervening dips, the
damping tail of the fluctuation spectrum expected at
1000 has been
seen, polarization has been observed, and the primary anisotropies are
predominantly Gaussian. WMAP has, additionally, measured the thickness of
the last scattering surface and observed the reionization of the Universe
when z ~ 20 by the first generation of stars
(Kogut et al. 2003).
Remaining to be established are secondary anisotropies, due, e.g., to the
Sunyaev-Zeldovich effect, weak lensing and inhomogeneous reionization, and
tensor perturbations induced by gravity waves.
As we also heard at this meeting, the values of
CDM inferred
from X-ray studies of gas in rich clusters using the Chandra satellite
(Rees 2003),
which indicate
CDM =
0.325 ± 0.34, gravitational lensing
(Schneider 2003)
and data on large-scale structure, e.g., from the 2dF galaxy redshift survey
(Peacock 2003a,
b),
are very consistent with
that inferred by combining CMB and supernova data. The WMAP data confirm
this concordance with higher precision:
CDM
h2 = 0.111 ± 0.009
(Spergel et al.
2003).
The 2dF galaxy survey has examined two wedges through the Universe. Significant structures are seen at low redshifts, which die away at larger redshifts where the Universe becomes more homogeneous and isotropic. The perturbation power spectrum at these large scales matches nicely with that seen in the CMB data, whilst the structures seen at small scales would not be present in a baryon-dominated Universe, or one with a significant fraction of hot dark matter. Indeed, the 2dF data were used to infer an upper limit on the sum of the neutrino masses of 1.8 eV (Elgaroy et al. 2002), which has recently been improved using WMAP data (Spergel et al. 2003) to
 |
(1.1) |
as seen in Fig. 5. This impressive upper limit is substantially better than even the most stringent direct laboratory upper limit on an individual neutrino mass, as discussed in the next Section. The WMAP data also provide (Crotty et al. 2003) a new limit on the effective number of light neutrino species, beyond the three within the Standard Model:
 |
(1.2) |
This limit is not as stringent as that from LEP, but applies to additional light degrees of freedom that might not be produced in Z decay.
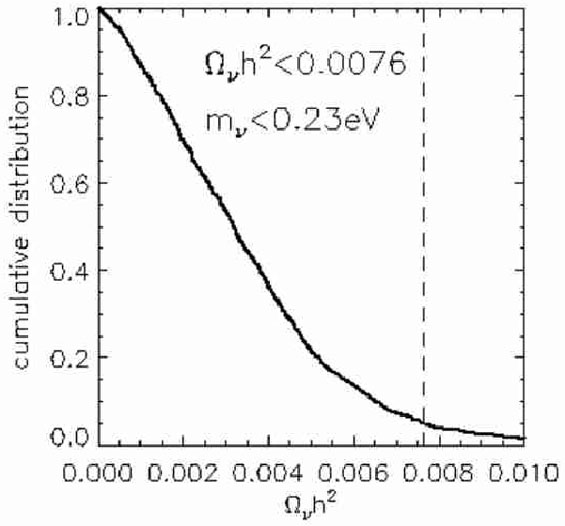 |
Figure 5. The likelihood function for the
total neutrino density
|
 , the
spectral index ns and its rate of change
dns / ln k, respectively.
, the
spectral index ns and its rate of change
dns / ln k, respectively. inferred from WMAP and other CMB data (WMAPext),
and from combining them with supernova and Hubble Space Telescope data
(
inferred from WMAP and other CMB data (WMAPext),
and from combining them with supernova and Hubble Space Telescope data
( h2
derived by WMAP
(
h2
derived by WMAP
(