


A disk that is intrinsically circular will appear elliptical in
projection on the sky. The viewing angles of the disk (see
Figure 6) are then easily determined: the
inclination is i = arccos(1 -
 ), where
is the
apparent ellipticity on the sky, and the line-of-nodes position angle
), where
is the
apparent ellipticity on the sky, and the line-of-nodes position angle
 is equal to the
major axis position angle
PAmaj of the projected body. The viewing angles of the
LMC have often
been estimated under this assumption, using the projected contours for
many different types of tracers
(de Vaucouleurs &
Freeman 1973;
Bothun & Thompson 1988;
Schmidt-Kaler &
Gochermann 1992;
Weinberg & Nikolaev
2001;
Lynga & Westerlund
1963;
Kontizas et al. 1990;
Feitzinger et al. 1977;
Kim et al. 1998;
Alvarez et al. 1987).
However, it now appears that this was incorrect. The kinematics of carbon
stars imply
= 129.9°
± 6.0° (see
Section 5.2), whereas the near-IR morphology
of the LMC implies
PAmaj = 189.3° ± 1.4° (see
Section 2). The result that
is equal to the
major axis position angle
PAmaj of the projected body. The viewing angles of the
LMC have often
been estimated under this assumption, using the projected contours for
many different types of tracers
(de Vaucouleurs &
Freeman 1973;
Bothun & Thompson 1988;
Schmidt-Kaler &
Gochermann 1992;
Weinberg & Nikolaev
2001;
Lynga & Westerlund
1963;
Kontizas et al. 1990;
Feitzinger et al. 1977;
Kim et al. 1998;
Alvarez et al. 1987).
However, it now appears that this was incorrect. The kinematics of carbon
stars imply
= 129.9°
± 6.0° (see
Section 5.2), whereas the near-IR morphology
of the LMC implies
PAmaj = 189.3° ± 1.4° (see
Section 2). The result that
 PAmaj
implies that the LMC cannot be intrinsically
circular. The value of PAmaj is quite robust; studies
of other tracers have yielded very similar results, although often
with larger error bars. The result that
PAmaj
therefore hinges primarily on our confidence in the inferred
value of . There
have been other kinematical studies of the
line of nodes, in addition to that described in
Section 5.2. These have generally yielded
values of
that are both
larger and twisting with radius (e.g.,
Kim et al. 1998;
Alves & Nelson 2000).
However, the accuracy of these
results is suspect because of the important simplifying assumptions
that were made in the analyses (see
Section 5.3). No
allowance was made for a potential solid-body rotation component in
the velocity field due to precession and nutation of the LMC disk,
which is both predicted theoretically
(Weinberg 2000)
and implied observationally by the carbon star data (see
Section 5.2).
PAmaj
implies that the LMC cannot be intrinsically
circular. The value of PAmaj is quite robust; studies
of other tracers have yielded very similar results, although often
with larger error bars. The result that
PAmaj
therefore hinges primarily on our confidence in the inferred
value of . There
have been other kinematical studies of the
line of nodes, in addition to that described in
Section 5.2. These have generally yielded
values of
that are both
larger and twisting with radius (e.g.,
Kim et al. 1998;
Alves & Nelson 2000).
However, the accuracy of these
results is suspect because of the important simplifying assumptions
that were made in the analyses (see
Section 5.3). No
allowance was made for a potential solid-body rotation component in
the velocity field due to precession and nutation of the LMC disk,
which is both predicted theoretically
(Weinberg 2000)
and implied observationally by the carbon star data (see
Section 5.2).
Arguably the most robust way to determine the LMC viewing angles is to
use geometrical considerations, rather than kinematical ones. For an
inclined disk, one side will be closer to us than the other. Tracers
on that one side will appear brighter than similar tracers on the
other side. This method does not rely on absolute distances or
magnitudes, which are notoriously difficult to estimate, but only on
relative distances or magnitudes. To lowest order, the difference in
magnitude between a tracer at the galaxy center and a similar tracer
at a position ( ,
,
 ) in the disk (as defined in
Section 5.1) is
) in the disk (as defined in
Section 5.1) is
 |
(6.1) |
where the angular distance
is expressed
in degrees. The constant in the equation is
(5 ) / (180 ln 10) = 0.038
magnitudes. Hence, when following a circle on the sky around the
galaxy center one expects a sinusoidal variation in the magnitudes of
tracers. The amplitude and phase of the variation yield estimates of
the viewing angles
(i, ).
) / (180 ln 10) = 0.038
magnitudes. Hence, when following a circle on the sky around the
galaxy center one expects a sinusoidal variation in the magnitudes of
tracers. The amplitude and phase of the variation yield estimates of
the viewing angles
(i, ).
Van der Marel & Cioni
(2001)
used a polar grid on the sky to divide the LMC area into several rings, each consisting of a
number of
azimuthal segments. The data from the DENIS and 2MASS surveys were
used for each segment to construct near-IR CMDs similar to that shown
in Figure 1. For each segment the
modal magnitude
(magnitude where the luminosity function peaks) was determined for
carbon-rich AGB stars selected by color, as had been suggested by
Weinberg & Nikolaev
(2001).
Figure 9 shows the inferred
variation in magnitude as function of position angle
for the
radial range 2.5°  6.7°. The expected
sinusoidal variations are confidently detected. The top panel shows
the results for stars selected from the DENIS survey with the color
selection criterion
1.5 J - K
2.0. The bottom panel shows
the results from the 2MASS survey with the same color selection. The
same sinusoidal variations are seen, indicating that there are no
relative calibration problems between the surveys. Also, the same
variations are seen in the I, J, H and
Ks bands, which
implies that the results are not influenced significantly by dust
absorption. The middle panel shows the variations in the TRGB
magnitudes as a function of position angle, from the DENIS data. RGB
stars show the same variations as the AGB stars, suggesting that the
results are not influenced significantly by potential peculiarities
associated with either of these stellar populations. The observed
variations can therefore be confidently interpreted as a purely
geometrical effect. The implied viewing angles are
i = 34.7° ± 6.2° and
= 122.5°
± 8.3°. The
value thus inferred
geometrically is entirely consistent with the value inferred kinematically
(see Section 5.2). Moreover, there is an
observed drift in the center of the LMC isophotes at large radii which
is consistent with both estimates, when interpreted as a result of
viewing perspective
(van der Marel 2001).
6.7°. The expected
sinusoidal variations are confidently detected. The top panel shows
the results for stars selected from the DENIS survey with the color
selection criterion
1.5 J - K
2.0. The bottom panel shows
the results from the 2MASS survey with the same color selection. The
same sinusoidal variations are seen, indicating that there are no
relative calibration problems between the surveys. Also, the same
variations are seen in the I, J, H and
Ks bands, which
implies that the results are not influenced significantly by dust
absorption. The middle panel shows the variations in the TRGB
magnitudes as a function of position angle, from the DENIS data. RGB
stars show the same variations as the AGB stars, suggesting that the
results are not influenced significantly by potential peculiarities
associated with either of these stellar populations. The observed
variations can therefore be confidently interpreted as a purely
geometrical effect. The implied viewing angles are
i = 34.7° ± 6.2° and
= 122.5°
± 8.3°. The
value thus inferred
geometrically is entirely consistent with the value inferred kinematically
(see Section 5.2). Moreover, there is an
observed drift in the center of the LMC isophotes at large radii which
is consistent with both estimates, when interpreted as a result of
viewing perspective
(van der Marel 2001).
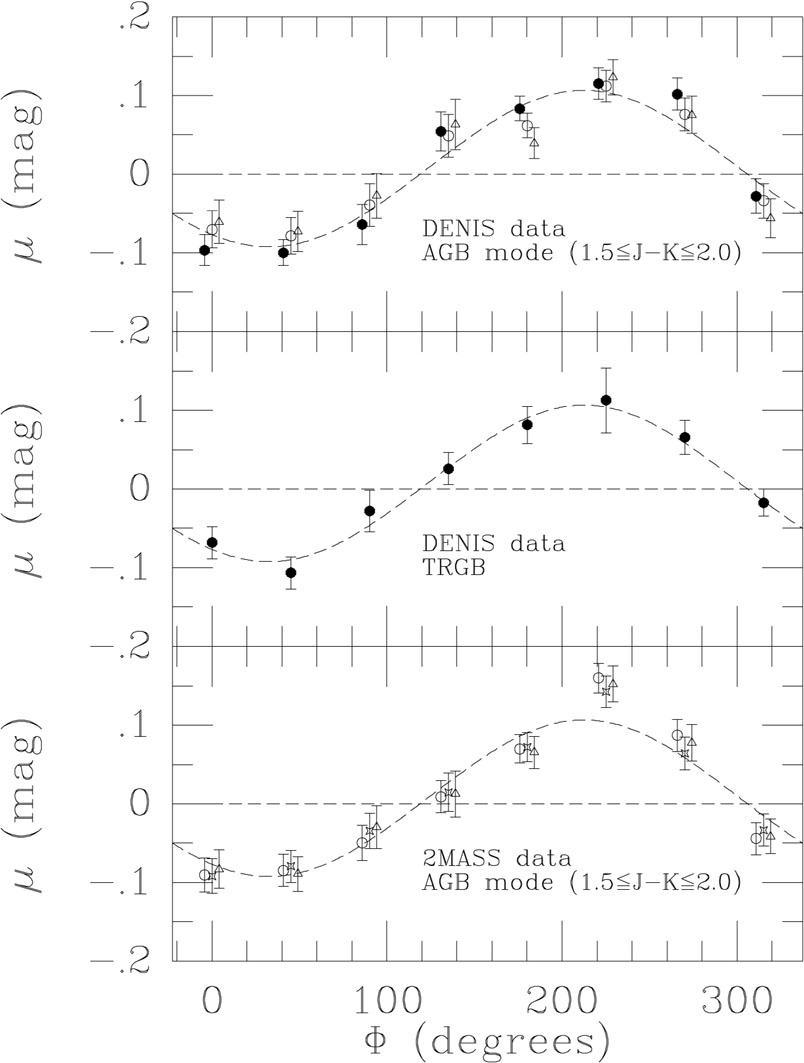 |
Figure 9. Variations in the magnitude of
tracers as function of position angle
|
The aforementioned analyses are sensitive primarily to the structure
of the outer parts of the LMC. Several other studies of the viewing
angles have focused mostly on the region of the bar, which samples
only the central few degrees. Many of these studies have been based on
Cepheids. Their period-luminosity relation allows calculation of the
distance to each individual Cepheid from a light curve. The relative
distances of the Cepheids in the sample can then be analyzed in
similar fashion as discussed above to yield the LMC viewing
angles. Cepheid studies in the 1980s didn't have many stars to work with.
Caldwell & Coulson
(1986)
analyzed optical data for 73 Cepheids and obtained
i = 29° ± 6° and
= 142° ±
8°.
Laney & Stobie (1986)
obtained i = 45° ± 7° and
= 145° ±
17° from 14 Cepheids, and
Welch et al. (1987)
obtained i = 37° ± 16° and
= 167° ±
42° from 23
Cepheids, both using near-IR data. The early Cepheid studies have now
all been superseded by the work of
Nikolaev et al. (2004).
They analyzed a sample of more than 2000 Cepheids with lightcurves from
MACHO data. Through use of photometry in five different bands,
including optical MACHO data and near-IR 2MASS data, each star could
be individually corrected for dust extinction. From a planar fit to
the data they obtained i = 30.7° ± 1.1° and
= 151.0°
± 2.4°. Other recent work has used the
magnitude of the Red Clump to analyze the relative distances of
different parts of the LMC.
Olsen & Salyk (2002)
obtained i = 35.8° ± 2.4° and
= 145° ±
4°, also from an analysis that was restricted mostly to the
the inner parts of the LMC.
There is one caveat associated with all viewing angle results for the
central few degrees of the LMC. Namely, it appears that the stars in
this region are not distributed symmetrically around a single
well-defined plane, as discussed in detail in
Section 8.4. In the present context we are
mainly concerned with the influence of this on the inferred viewing angles.
Olsen & Salyk (2002)
perform their viewing angle fit by
ignoring fields south-west of the bar, which do not seem to agree with
the planar solution implied by their remaining fields. By contrast,
Nikolaev et al. (2004)
fit all the stars in their sample, independent
of whether or not they appear to be part of the main disk
plane. Clearly, the
(i,) results
of Olsen & Salyk and
Nikolaev et al. are the best-fitting parameters of well-posed
problems. However, it is somewhat unclear whether they can be assumed
to be unbiased estimates of the actual LMC viewing angles. For a
proper understanding of this issue one would need to have both an empirical
and a dynamical understanding of the nature of the extra-planar
structures in the central region of the LMC. Only then is it possible
to decide whether the concept of a single disk plane is at all
meaningful in this region, and which data should be included or
excluded in determining its parameters. This is probably not an issue
for the outer parts of the LMC, given that the AGB star results of
van der Marel & Cioni
(2001)
provide no evidence for extra-planar structures at radii
 2.5°.
2.5°.
In summary, all studies agree that i is in the range
30°-40°. At large radii,
appears to be in
the range 115°-135°. By contrast, at small radii
all studies indicate that
is in the range
140°-155°. As mentioned, it is possible that the
results at small radii are systematically in error due to the presence
of out-of-plane structures. Alternatively, it is quite well possible
that there are true radial variations in the LMC viewing angles due to
warps and twists of the disk plane. Many authors have suggested this
as a plausible interpretation of various features seen in LMC datasets
(van der Marel & Cioni
2001;
Olsen & Salyk 2002;
Subramaniam 2003;
Nikolaev et al. 2004).
Moreover, numerical simulations have shown that
Milky Way tidal effects can drive strong warps in the LMC disk plane
(Mastropietro et al. 2004).