


Defining the SED of quasars is an extremely difficult task from an observational point of view. This is mainly due to observational biases introduced by the narrow wavelength ranges used for the selection of all quasar samples.
Historically, the most common technique for quasar selection has been the UV-blue excess in the quasar continuum. For example, the best-studied quasar sample, the Bright Quasar Survey sample (part of the Palomar-Green survey, Schmidt & Green 1983, and hereafter referred to as "PG quasars"), is defined through a magnitude limit (B < 16.2, MV < -23) and a color limit (U - B < -0.4). Detailed studies of this sample of quasars revealed a remarkable homogeneity in their continua (Sanders et al. 1989; E94) and line properties from the infrared to the X-rays (Laor et al. 1997), with the exception of a small fraction (~ 10%) of Broad Absorption Line (BAL) objects with quite different continua and line properties. Subsequent quasar samples have been obtained with deeper surveys but similar selection criteria.
However, the blue selection method is in no way complete and can provide only a partial view of the general quasar SED. This is evident in Figure 1, which shows the location of quasars from the Anglo-Australian Telescope's Two Degree Field (2dF) QSO Redshift Survey (Croom et al. 2002) in the (B - V, U - B) plane. The "classical" UV excess selection criterion (horizontal line) was chosen for efficiency (selecting objects that are quasars) and not for completeness (selecting all quasars). Hence, the selection limit is in no way related to any intrinsic property of the quasars, but rather to the UV emission of stars: the color limit is chosen in order to reject the great majority of stars and thus have a high efficiency in quasar selection. In principle, a more relaxed color selection would find more quasars, but the fraction of stars among the selected objects would be much higher, making the spectroscopic follow-up extremely time-consuming.
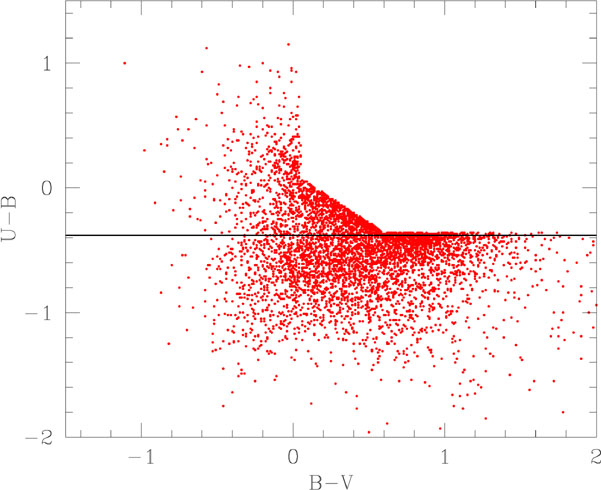 |
Figure 1. Color-color diagram for 2dF quasars. Horizontal line shows the "classical" selection criterion for blue quasars (U - B < -0.4). Empty region in the upper right is dominated by stars, and has therefore been excluded in the 2dF quasar search. |
Many other criteria have been adopted in order to increase the completeness. At other wavelengths, radio surveys like the Very Large Array (VLA)'s Faint Images of the Radio Sky at Twenty-cm (FIRST) Bright Quasar Survey (White et al. 2000) are now deep enough to find "radio-quiet" objects (which are much fainter than radio-loud quasars at radio wavelengths, but are still detectable). X-ray surveys are also effective at discovering AGN that would be missed in optical searches because of their red colors or because of absorption (Brusa et al. 2003; Barger et al. 2003). In the optical band, spectroscopic criteria have been used to discover quasars from their broad emission lines instead of their continuum properties, e.g., the Palomar-Grism survey (Schneider et al. 1994), the Hamburg Quasar Survey (Hagen et al. 1995), and the Hamburg-ESO survey (Wisotzki et al. 1996). Finally, multicolor optical selections have been used in recent surveys, like the Sloan Digital Sky Survey (SDSS).
In the following, we will focus on blue-selected quasars in order to build a quasar SED. The reason for this choice is twofold: (i) blue-selected quasars are currently the best-studied, i.e., the ones with the best available multiwavelength observational data, and (2) their emission is thought to be representative of the intrinsic emission of most quasars. The cases for intrinsically different SEDs and for absorbed objects will be discussed later.
The standard reference for quasar SEDs is the atlas of E94, who collected observations of bright quasars from radio to hard X-ray wavelengths. The mean SED from this work is often cited as the "standard" quasar SED, and the main properties of this SED are in good agreement with the SEDs of optically selected quasars, such as the PG quasars. However, even within this sample, the 90% range of SEDs spans factors of ~ 10 or more at most frequencies. There are three main limitations to the E94 atlas:
1) Selection criterion. The E94 sample is defined by requiring
the presence of a detection sufficient to yield a spectrum in an
Einstein Observatory X-ray observation. As discussed in E94,
this introduces a well known bias towards X-ray bright objects. For
comparison, the average optical-to-X-ray flux ratio
index (1),
 OX, is 1.35
for the E94 sample and 1.55 for the low redshift PG quasars
(Laor et al. 1997),
corresponding to a factor of 3 higher X-ray emission in the E94 sample.
OX, is 1.35
for the E94 sample and 1.55 for the low redshift PG quasars
(Laor et al. 1997),
corresponding to a factor of 3 higher X-ray emission in the E94 sample.
2) Lack of data. The E94 sample did not have data in the range between the Lyman edge (13.2 eV) and the soft X-rays (0.2 - 0.4 keV).
3) Limited number of quasars. The E94 sample had 29 radio-quiet quasars and 18 radio-loud.
The first two points can now be addressed well, and a significant improvement is also possible for the third point. It is possible to quantitatively discuss the effects of the first point using observations at different wavelengths to estimate the correct ratios between the emissions in the different bands. Regarding the second point, a big part of the gap between the Lyman edge and the soft X-rays can now be filled, thanks to the availability of Hubble Space Telescope (HST) and Far Ultraviolet Spectroscopic Explorer (FUSE) UV spectra of high redshift quasars.
In the following, we build an average SED using mainly - but not only - the best studied quasars, i.e., the local (z < 0.4) PG quasars (B < 16.2, U - B < -0.4). We adopt a slightly different approach with respect to E94: in order to produce a final average SED, we work out the average spectrum in each observational band, and then we estimate the bolometric corrections for each spectral region. We make use of the latest observational results, in particular, those from the Infrared Space Observatory (ISO) in the infrared (Haas et al. 2003), HST in the UV for quasars (Telfer et al. 2002) and bright, lower luminosity Seyfert 1 galaxies (Crenshaw et al. 1999), and ROSAT, BeppoSAX, and ASCA in the X-rays (Laor et al. 1997; Mineo et al. 2000; George et al. 2000).
1
OX is defined
as the slope
of a nominal power law connecting the continuum at 2500 Å with
that at 2 keV
(OX = 0.385
× log(f (2500Å) / f (2 keV))
Back.