


2.1. Optical/UV
The optical to UV emission of quasars is characterized by the
"big blue bump"
(Shields 1978;
Malkan & Sargent
1982;
Elvis 1985),
where the peak of quasar emission is usually found. The peak energy
is around the Lyman edge
( = 1216 Å), and
the spectrum can
be well approximated with a power law both at lower and higher
frequencies. Recent observations performed with HST of over
200 quasars (compiled by
Telfer et al. 2002)
provide a good quality mean spectrum from
~ 300 Å to
~ 3000 Å.
Composite spectra (see Fig. 2)
extending from
~ 1200 Å to
~ 9000 Å have
been obtained using data from ground-based optical surveys like the UK
Schmidt Telescope's Large Bright QSO Survey
(Francis et al. 1991),
the 2dF
(Croom et al. 2002),
the optical follow-up of the FIRST radio survey
(Brotherton et
al. 2001),
and the SDSS
(Vanden Berk et
al. 2001).
The SDSS includes more than
2200 spectra at redshifts between 0 and ~ 5, providing the most
accurate average optical spectrum of quasars so far, with a spectral
resolution of a few Å. In the overlapping band (~ 1200 - 3800 Å),
the HST and SDSS results match within the errors,
providing a complete quasar spectrum in the 300 - 9000 Å band.
The main results of these studies are the following:
= 1216 Å), and
the spectrum can
be well approximated with a power law both at lower and higher
frequencies. Recent observations performed with HST of over
200 quasars (compiled by
Telfer et al. 2002)
provide a good quality mean spectrum from
~ 300 Å to
~ 3000 Å.
Composite spectra (see Fig. 2)
extending from
~ 1200 Å to
~ 9000 Å have
been obtained using data from ground-based optical surveys like the UK
Schmidt Telescope's Large Bright QSO Survey
(Francis et al. 1991),
the 2dF
(Croom et al. 2002),
the optical follow-up of the FIRST radio survey
(Brotherton et
al. 2001),
and the SDSS
(Vanden Berk et
al. 2001).
The SDSS includes more than
2200 spectra at redshifts between 0 and ~ 5, providing the most
accurate average optical spectrum of quasars so far, with a spectral
resolution of a few Å. In the overlapping band (~ 1200 - 3800 Å),
the HST and SDSS results match within the errors,
providing a complete quasar spectrum in the 300 - 9000 Å band.
The main results of these studies are the following:
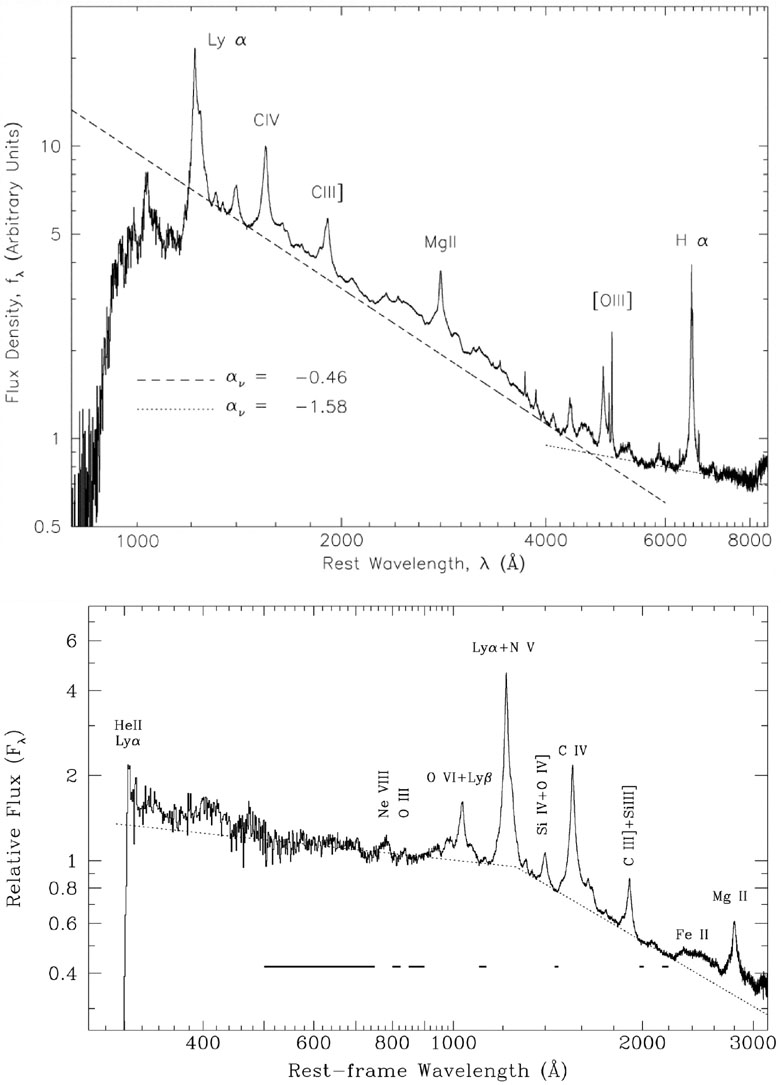 |
Figure 2. Composite optical/UV spectra of quasars. (Upper panel) Results from the SDSS (Vanden Berk et al. 2001; their Fig. 3). (Lower panel) Results from HST (Telfer et al. 2002; their Fig. 4). Dotted and dashed lines are power law fits to the continuum. Horizontal thick lines in the lower panel show the spectral regions used to estimate the continuum level. |
 The 300 - 5000 Å
continuum can be modeled with two power laws with slopes
(2)
The 300 - 5000 Å
continuum can be modeled with two power laws with slopes
(2)
 1 = -1.76
between 300 Å and ~ 1200 Å and
2 = -0.44
between 1200 Å and 5000 Å. At longer wavelengths, the spectrum
appears to flatten significantly, but this effect is probably due to the
contribution of galactic emission in the quasar spectra (see
Vanden Berk et al. 2001
for more details).
1 = -1.76
between 300 Å and ~ 1200 Å and
2 = -0.44
between 1200 Å and 5000 Å. At longer wavelengths, the spectrum
appears to flatten significantly, but this effect is probably due to the
contribution of galactic emission in the quasar spectra (see
Vanden Berk et al. 2001
for more details).
No correlation
between optical continuum properties and
redshift or luminosity has been found. An anticorrelation between
the equivalent width (EW) of the main emission lines and the luminosity
(the "Baldwin effect",
Baldwin 1977)
has been found.
Hundreds of emission
lines are present in quasar spectra (a compilation of the brightest ones
is given in
Table 1). In addition to these lines,
another major feature in the optical/UV spectra of quasars is the
"small blue bump"
(Wills, Netzer, &
Wills 1985;
Elvis 1985)
between ~ 2200 Å and ~ 4000 Å. This is not a true continuum
feature but is due to a forest of emission lines from the ion FeII
and the Balmer recombination continuum. Permitted emission lines are
"broad" (corresponding to velocities of the emitting gas of
2000 - 15000 km s-1), while forbidden lines are narrow (a few
hundred km s-1).
| Line |
(Å) |
<EW(Å)> | Ref. | Line |
(Å) |
<EW(Å)> | Ref. |
| CIII+NIII | 980 | 9.7±0.2 | (1) | MgII | 2799 | 32.3±0.1 | (2) |
OVI +
Ly |
1030 | 15.6±0.3 | (1) | H |
4103 | 5.05±0.06 | (2) |
| Ly |
1216 | 91.8±0.7 | (1) | H |
4341 | 12.6±0.1 | (2) |
| N V | 1240 | 18.5±0.5 | (1) | H |
4863 | 46.2±0.2 | (2) |
| SiIV+OIV] | 1397 | 8.13±0.09 | (2) | [OIII] | 5007 | 13.2±0.2 | (2) |
| CIV | 1549 | 23.8±0.1 | (2)a | H |
6565 | 194.5±0. | (2) |
| CIII] | 1909 | 21.2±0.1 | (2) | ||||
References - (1)
Telfer et al. 2002
(for lines at
|
|||||||
A minority (~ 10 -
20%) of quasars show broad absorption
lines, often saturated, with widths and blueshifts of several
thousand km s-1 and peaks of 20,000 - 30,000 km s-1.
~ 50% of bright
Seyfert 1 galaxies observed in the UV
with HST or FUSE show evidence of Narrow Absorption Lines
(NAL), with widths of ~ 1000 km s-1, in the profiles of
high ionization emission lines (OVI, CIV,
Ly).
The presence of such features is strongly correlated
with the presence of warm absorbers in the soft X-rays
(see Section 2.4).
2 Somewhat different conventions are used
for the power law index: photon index
 in the X-rays
(counts/sec/keV
in the X-rays
(counts/sec/keV  E-),
in the radio
(f
E-),
in the radio
(f ), and
- or
in the optical. In this review, we follow the radio convention, as
it is mathematically correct in the
log f versus
space.
Back.
), and
- or
in the optical. In this review, we follow the radio convention, as
it is mathematically correct in the
log f versus
space.
Back.