


2.4. Nonstandard BBN
The predictions of the primordial abundance of 4He depend
sensitively on the early expansion rate (the Hubble parameter H)
and on the amount - if any - of a
 e -
e -
 e asymmetry
(the e chemical
potential µe or the neutrino degeneracy parameter
e asymmetry
(the e chemical
potential µe or the neutrino degeneracy parameter
 e). In
contrast to 4He, the BBN-predicted abundances of D,
3He and 7Li are determined by the
competition between the various two-body production/destruction rates
and the universal expansion rate. As a result, the D, 3He,
and 7Li abundances are sensitive to the
post-e± annihilation expansion rate, while
that of 4He depends on both the pre- and
post-e± annihilation expansion rates;
the former determines the "freeze-in" and the latter modulates the
importance of
e). In
contrast to 4He, the BBN-predicted abundances of D,
3He and 7Li are determined by the
competition between the various two-body production/destruction rates
and the universal expansion rate. As a result, the D, 3He,
and 7Li abundances are sensitive to the
post-e± annihilation expansion rate, while
that of 4He depends on both the pre- and
post-e± annihilation expansion rates;
the former determines the "freeze-in" and the latter modulates the
importance of
 -decay (see,
e.g.,
Kneller & Steigman
2003).
Also, the primordial abundances of D, 3He, and
7Li, while not entirely insensitive to neutrino
degeneracy, are much less affected by a nonzero
e
(e.g.,
Kang & Steigman
1992).
Each of these nonstandard cases will be considered below.
Note that the abundances of at least two different relic nuclei are needed
to break the degeneracy between the baryon density and a possible
nonstandard expansion rate resulting from new physics or cosmology,
and/or a neutrino asymmetry.
-decay (see,
e.g.,
Kneller & Steigman
2003).
Also, the primordial abundances of D, 3He, and
7Li, while not entirely insensitive to neutrino
degeneracy, are much less affected by a nonzero
e
(e.g.,
Kang & Steigman
1992).
Each of these nonstandard cases will be considered below.
Note that the abundances of at least two different relic nuclei are needed
to break the degeneracy between the baryon density and a possible
nonstandard expansion rate resulting from new physics or cosmology,
and/or a neutrino asymmetry.
2.4.1. Additional Relativistic Energy Density
The most straightforward variation of SBBN is to consider the effect of
a nonstandard expansion rate H'
 H. To quantify the
deviation from
the standard model it is convenient to introduce the "expansion rate
factor" (or speedup/slowdown factor) S, where
H. To quantify the
deviation from
the standard model it is convenient to introduce the "expansion rate
factor" (or speedup/slowdown factor) S, where
 |
(7) |
Such a nonstandard expansion rate might result from the presence of "extra" energy contributed by new, light (relativistic at BBN) particles "X". These might, but need not, be additional flavors of active or sterile neutrinos. For X particles that are decoupled, in the sense that they do not share in the energy released by e± annihilation, it is convenient to account for the extra contribution to the standard-model energy density by normalizing it to that of an "equivalent" neutrino flavor (Steigman et al. 1977),
 |
(8) |
For SBBN,  N = 0
(N
N = 0
(N
 3 +
N) and for each
such additional "neutrino-like" particle (i.e. any two-component
fermion), if TX =
T, then
N = 1; if
X should be a scalar,
N =
4/7. However, it may well be that the X have decoupled even
earlier in
the evolution of the Universe and have failed to profit from the heating
when various other particle-antiparticle pairs annihilated (or unstable
particles decayed). In this case, the contribution to
N from each
such particle will be < 1 (< 4/7). Henceforth we drop the X
subscript. Note that, in principle, we are considering any term in the
energy density that scales like "radiation" (i.e. decreases with the
expansion of the Universe as the fourth power of the scale factor). In
this sense, the modification to the usual Friedman equation due to higher
dimensional effects, as in the Randall-Sundrum model
(Randall & Sundrum
1999a,
b;
see also
Cline, Grojean, &
Servant 1999;
Binetruy et al. 2000;
Bratt et al. 2002),
may be included as well. The interest in this latter
case is that it permits the possibility of an apparent negative
contribution to the radiation density
(
N < 0;
S < 1). For such a modification to the energy density, the
pre-e± annihilation
energy density in Equation 1 is changed to
3 +
N) and for each
such additional "neutrino-like" particle (i.e. any two-component
fermion), if TX =
T, then
N = 1; if
X should be a scalar,
N =
4/7. However, it may well be that the X have decoupled even
earlier in
the evolution of the Universe and have failed to profit from the heating
when various other particle-antiparticle pairs annihilated (or unstable
particles decayed). In this case, the contribution to
N from each
such particle will be < 1 (< 4/7). Henceforth we drop the X
subscript. Note that, in principle, we are considering any term in the
energy density that scales like "radiation" (i.e. decreases with the
expansion of the Universe as the fourth power of the scale factor). In
this sense, the modification to the usual Friedman equation due to higher
dimensional effects, as in the Randall-Sundrum model
(Randall & Sundrum
1999a,
b;
see also
Cline, Grojean, &
Servant 1999;
Binetruy et al. 2000;
Bratt et al. 2002),
may be included as well. The interest in this latter
case is that it permits the possibility of an apparent negative
contribution to the radiation density
(
N < 0;
S < 1). For such a modification to the energy density, the
pre-e± annihilation
energy density in Equation 1 is changed to
 |
(9) |
Since any extra energy density
(
N > 0)
speeds up the expansion of the Universe (S > 1), the
right-hand side of the time-temperature relation in Equation 3 is
smaller by the square root of the factor in parentheses in Equation 9.
 |
(10) |
In the post-e± annihilation Universe the extra energy density is diluted by the heating of the photons, so that
 |
(11) |
and
 |
(12) |
While the abundances of D, 3He, and 7Li are most
sensitive to the baryon density
( ), the
4He mass fraction (Y) provides
the best probe of the expansion rate. This is illustrated in
Figure 2 where, in the
N -
10
plane, are shown
isoabundance contours for D/H and YP (the isoabundance curves
for 3He/H and for 7Li/H, omitted for clarity, are
similar in behavior to that of D/H). The trends illustrated in
Figure 2 are easy to understand in the context
of the discussion above. The higher the baryon density
(10),
the faster primordial D is destroyed, so the relic abundance of
D is anticorrelated with
10.
But, the faster the Universe expands
(
N > 0),
the less time is available for D destruction, so D/H is positively,
albeit weakly, correlated with
N. In
contrast to D (and to 3He and 7Li),
since the incorporation of all available neutrons into 4He is
not limited by the nuclear reaction rates, the 4He mass fraction
is relatively insensitive to the baryon density, but it is very
sensitive to both the pre- and post-e±
annihilation expansion
rates (which control the neutron-to-proton ratio). The faster
the Universe expands, the more neutrons are available for 4He.
The very slow increase of YP with
10
is a reflection of the fact that for a higher baryon density, BBN begins
earlier, when there are more neutrons. As a result of these complementary
correlations, the pair of primordial abundances
yD
105(D / H)P and YP, the
4He mass fraction, provide
observational constraints on both the baryon density
() and
on the universal expansion rate factor S (or on
N)
when the Universe was some 20 minutes old. Comparing these to
similar constraints from when the Universe was some 380 Kyr old,
provided by the WMAP observations of the CBR polarization and
the spectrum of temperature fluctuations, provides a test of
the consistency of the standard models of cosmology and of
particle physics and further constrains the allowed range of
the present-Universe baryon density (e.g.,
Barger et al. 2003a,
b;
Crotty, Lesgourgues,
& Pastor 2003;
Hannestad 2003;
Pierpaoli 2003).
), the
4He mass fraction (Y) provides
the best probe of the expansion rate. This is illustrated in
Figure 2 where, in the
N -
10
plane, are shown
isoabundance contours for D/H and YP (the isoabundance curves
for 3He/H and for 7Li/H, omitted for clarity, are
similar in behavior to that of D/H). The trends illustrated in
Figure 2 are easy to understand in the context
of the discussion above. The higher the baryon density
(10),
the faster primordial D is destroyed, so the relic abundance of
D is anticorrelated with
10.
But, the faster the Universe expands
(
N > 0),
the less time is available for D destruction, so D/H is positively,
albeit weakly, correlated with
N. In
contrast to D (and to 3He and 7Li),
since the incorporation of all available neutrons into 4He is
not limited by the nuclear reaction rates, the 4He mass fraction
is relatively insensitive to the baryon density, but it is very
sensitive to both the pre- and post-e±
annihilation expansion
rates (which control the neutron-to-proton ratio). The faster
the Universe expands, the more neutrons are available for 4He.
The very slow increase of YP with
10
is a reflection of the fact that for a higher baryon density, BBN begins
earlier, when there are more neutrons. As a result of these complementary
correlations, the pair of primordial abundances
yD
105(D / H)P and YP, the
4He mass fraction, provide
observational constraints on both the baryon density
() and
on the universal expansion rate factor S (or on
N)
when the Universe was some 20 minutes old. Comparing these to
similar constraints from when the Universe was some 380 Kyr old,
provided by the WMAP observations of the CBR polarization and
the spectrum of temperature fluctuations, provides a test of
the consistency of the standard models of cosmology and of
particle physics and further constrains the allowed range of
the present-Universe baryon density (e.g.,
Barger et al. 2003a,
b;
Crotty, Lesgourgues,
& Pastor 2003;
Hannestad 2003;
Pierpaoli 2003).
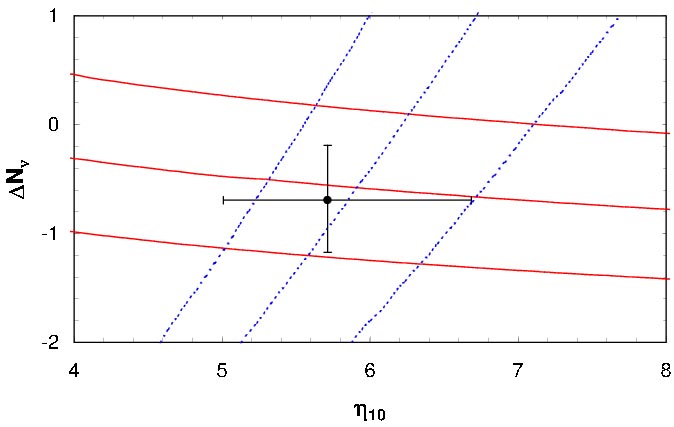 |
Figure 2. Isoabundance curves for D and
4He in the
|
The baryon-to-photon ratio provides a dimensionless measure of the
universal baryon asymmetry, which is very small
(
 10-9).
By charge neutrality the asymmetry in the charged leptons must also be
of this order. However, there are no observational constraints, save
those to be discussed here (see
Kang & Steigman
1992;
Kneller et al. 2001,
and further references therein), on the magnitude of any
asymmetry among the neutral leptons (neutrinos). A relatively small
asymmetry between electron type neutrinos and antineutrinos
(e
10-9).
By charge neutrality the asymmetry in the charged leptons must also be
of this order. However, there are no observational constraints, save
those to be discussed here (see
Kang & Steigman
1992;
Kneller et al. 2001,
and further references therein), on the magnitude of any
asymmetry among the neutral leptons (neutrinos). A relatively small
asymmetry between electron type neutrinos and antineutrinos
(e
 10-2)
can have a significant impact on the early-Universe
ratio of neutrons to protons, thereby affecting the yields of the
light nuclides formed during BBN. The strongest effect is on the
BBN 4He abundance, which is neutron limited. For
e > 0,
there is an excess of neutrinos
(e) over antineutrinos
(e), and the
two-body reactions regulating the neutron-to-proton ratio (Eq. 5) drive
down the neutron abundance; the reverse is true for
e <
0. The effect of a nonzero
e asymmetry on the
relic abundances of the other light nuclides is much weaker. This is
illustrated in Figure 3,
which shows the D and 4He isoabundance curves in the
e -
10
plane. The nearly horizontal 4He curves reflect
the weak dependence of YP on the baryon density, along with its
significant dependence on the neutrino asymmetry. In contrast,
the nearly vertical D curves reveal the strong dependence of
yD
on the baryon density and its weak dependence on any neutrino
asymmetry (3He/H and 7Li/H behave similarly:
strongly dependent
on , weakly
dependent on
e).
This complementarity between yD and YP
permits the pair {,
e}
to be determined once the primordial abundances of D and 4He are
inferred from the appropriate observational data.
10-2)
can have a significant impact on the early-Universe
ratio of neutrons to protons, thereby affecting the yields of the
light nuclides formed during BBN. The strongest effect is on the
BBN 4He abundance, which is neutron limited. For
e > 0,
there is an excess of neutrinos
(e) over antineutrinos
(e), and the
two-body reactions regulating the neutron-to-proton ratio (Eq. 5) drive
down the neutron abundance; the reverse is true for
e <
0. The effect of a nonzero
e asymmetry on the
relic abundances of the other light nuclides is much weaker. This is
illustrated in Figure 3,
which shows the D and 4He isoabundance curves in the
e -
10
plane. The nearly horizontal 4He curves reflect
the weak dependence of YP on the baryon density, along with its
significant dependence on the neutrino asymmetry. In contrast,
the nearly vertical D curves reveal the strong dependence of
yD
on the baryon density and its weak dependence on any neutrino
asymmetry (3He/H and 7Li/H behave similarly:
strongly dependent
on , weakly
dependent on
e).
This complementarity between yD and YP
permits the pair {,
e}
to be determined once the primordial abundances of D and 4He are
inferred from the appropriate observational data.
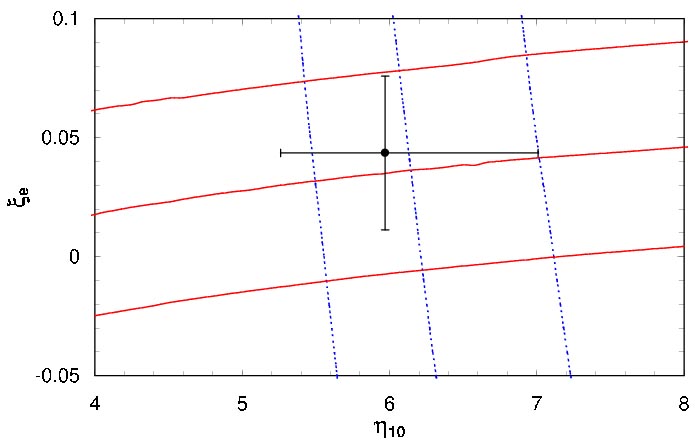 |
Figure 3. Isoabundance curves for D and
4He in the
|