


2.4. Radio Galaxies and Active Galactic Nuclei
Blazars are active galactic nuclei (AGNs) with a) strong flat spectrum
radio emission [the power law index
 > -0.5, with
S(
> -0.5, with
S( )
)
 ]
and/or b) significant optical polarization, and/or c) significant
flux variability in the optical and in other wavelengths. When the
optical variability occurs on short timescales, the objects are
referred to as optically violently variable - OVV - quasars. The
blazar classification also includes BL Lacertae (BL Lac) objects,
which present a complete or nearly complete lack of emission
lines, and highly polarized quasars (HPQs). It also refers,
sometimes, to flat spectrum radio quasars (FSRQs), although these
are generally more distant, more luminous, and have stronger
emission lines. Within the unification model, the underlying
scenario for all AGNs is intrinsically similar. At the very center
of the galaxy there is a supermassive black hole (~ 106 to
~ 1010
M
]
and/or b) significant optical polarization, and/or c) significant
flux variability in the optical and in other wavelengths. When the
optical variability occurs on short timescales, the objects are
referred to as optically violently variable - OVV - quasars. The
blazar classification also includes BL Lacertae (BL Lac) objects,
which present a complete or nearly complete lack of emission
lines, and highly polarized quasars (HPQs). It also refers,
sometimes, to flat spectrum radio quasars (FSRQs), although these
are generally more distant, more luminous, and have stronger
emission lines. Within the unification model, the underlying
scenario for all AGNs is intrinsically similar. At the very center
of the galaxy there is a supermassive black hole (~ 106 to
~ 1010
M ) which
accretes galactic matter
forming an accretion disk. Broad emission lines are produced in
clouds orbiting above the disc at high velocity, the broad line
region (BLR) and this central region is surrounded by an
extended, dusty, molecular torus. A hot electron corona populates
the inner region, probably generating continuum X-ray emission.
Narrower emission lines are produced in clouds moving much farther
from the central black hole. Two-sided jets of relativistic
particles emanate perpendicular to the plane of the accretion
disc, the generation of which is still not fully understood.
Unification of different AGN classes is achieved taken into
account the intrinsic anisotropy of the phenomenon, as shown in
Fig. 5 (see Refs.
[200,
201,
202,
203]
for further and more detailed discussions).
) which
accretes galactic matter
forming an accretion disk. Broad emission lines are produced in
clouds orbiting above the disc at high velocity, the broad line
region (BLR) and this central region is surrounded by an
extended, dusty, molecular torus. A hot electron corona populates
the inner region, probably generating continuum X-ray emission.
Narrower emission lines are produced in clouds moving much farther
from the central black hole. Two-sided jets of relativistic
particles emanate perpendicular to the plane of the accretion
disc, the generation of which is still not fully understood.
Unification of different AGN classes is achieved taken into
account the intrinsic anisotropy of the phenomenon, as shown in
Fig. 5 (see Refs.
[200,
201,
202,
203]
for further and more detailed discussions).
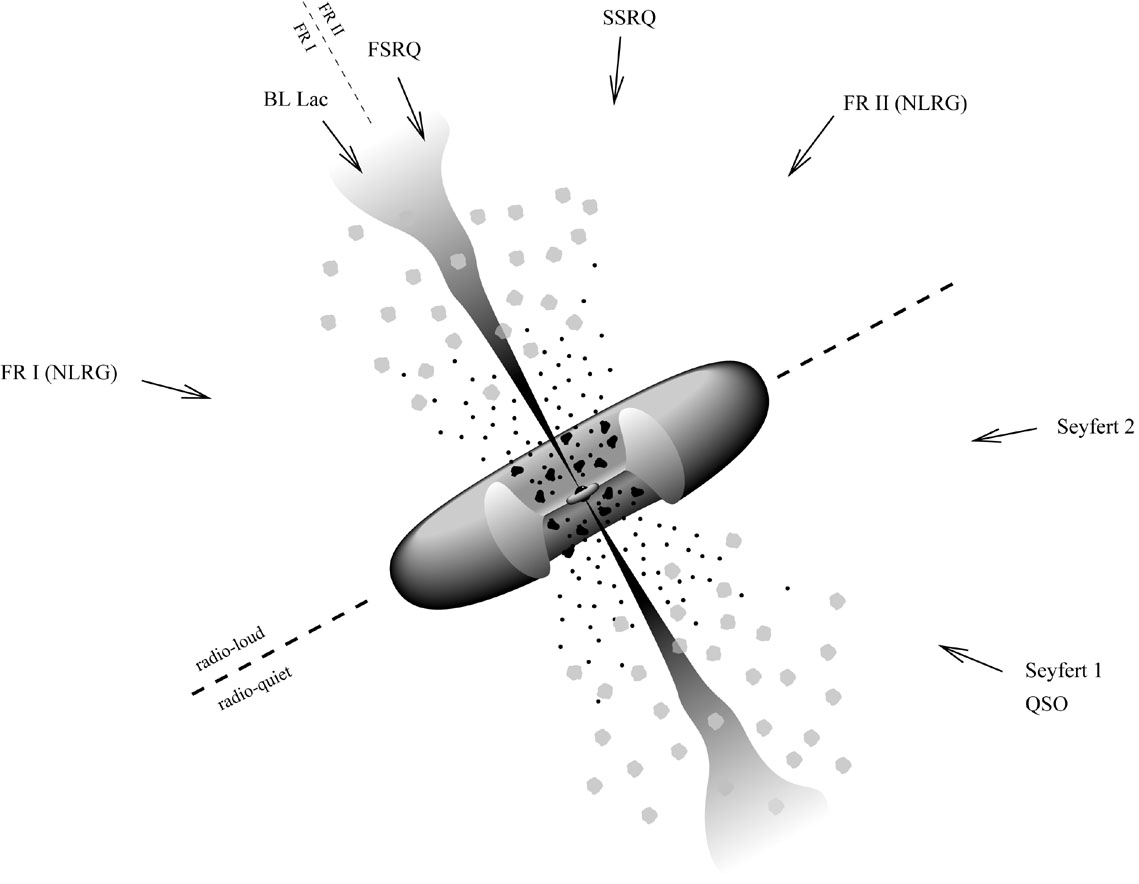 |
Figure 5. The unification model for AGNs. The components of the figure are discussed in the text. Blazars are those AGNs for which the jets are close to line of sight. A regular quasar or a Seyfert 1 galaxy is observed if the orientation angle is ~ 30°, where the narrow-line and broad-line regions are visible. At larger angular offsets, the broad-line region will be hidden by the torus, the corresponding class being Seyfert 2 galaxies. Perpendicular to the jet axis, the full extent of the jets may be seen particular at low frequencies, giving rise to a morphology typical of radio galaxies. The figure is adapted from Refs. [200, 201, 202, 203]. |
For example, Seyfert galaxies possess a dusty torus of gas at distances intermediate between the BLR and NLR (narrow line region). An observer whose line of sight to the black hole intercepts this torus would see a heavily reddened (or completely extinguished) BLR and central continuum radiation but an unreddened NLR. This would be identified with a Seyfert 2 galaxy. If the line-of-sight does not intercept the torus, the central regions of the nucleus can be observed directly, leading to a Seyfert 1 classification. Radio loud quasars are then objects in which the line-of-sight is close to the jet cone of the source. In the cases in which we are not directly looking into the jet cone -blazars where relativistic effects produce highly variable and continuum dominated emission- emission from the BLR can be observed. Objects with larger inclinations have a less dominant central continuum flux, resulting in Fanaroff-Riley II (FRII) galaxies. If the torus surrounding the black hole obscures the BLR, a narrow line radio galaxy (NLRG) can be observed. It is not clear how FRI radio galaxies fit into such a scheme. Clearly, some (as yet unknown) physical mechanism, probably related to source power, produces different radio morphologies in FRI and FRII sources. (15) Some blazars may be beamed FRI objects, but there is a lack of broad-line FRI radio galaxies [200]. This make the classification within the unified scheme harder to achieve.
FRII galaxies
[205] are the largest
known dissipative objects (non-thermal sources) in the Universe.
Localized regions of intense synchrotron emission, known as "hot
spots", are observed within their lobes. These regions are
presumably produced when the bulk kinetic energy of the jets
ejected by a central active nucleus (supermassive black hole +
accretion disk) is reconverted into relativistic particles and
turbulent fields at a "working surface" in the head of the jets
[206].
Specifically, the speed vh with which
the head of a jet advances into the intergalactic medium of
particle density ne can be obtained by balancing the
momentum flux in the jet against the momentum flux of the
surrounding medium. Measured in the frame comoving with the advancing head,
vh  vj [1 + (ne /
nj)1/2]-1,
where nj and vj are
the particle density and the velocity of the jet flow,
respectively. vj > vh for
ne
vj [1 + (ne /
nj)1/2]-1,
where nj and vj are
the particle density and the velocity of the jet flow,
respectively. vj > vh for
ne  nj, and the jet will decelerate. The result is the
formation of a strong collisionless shock, which is responsible for particle
reacceleration and magnetic field amplification
[207].
The acceleration of particles up to ultrarelativistic energies in
the hot spots is the result of repeated scattering back and forth
across the shock front
[208].
Dimensional arguments suggest that the energy density per unit of wave
number of MHD turbulence is of the Kolmogorov type
[209],
and so for strong shocks the acceleration time for protons is
[210]
nj, and the jet will decelerate. The result is the
formation of a strong collisionless shock, which is responsible for particle
reacceleration and magnetic field amplification
[207].
The acceleration of particles up to ultrarelativistic energies in
the hot spots is the result of repeated scattering back and forth
across the shock front
[208].
Dimensional arguments suggest that the energy density per unit of wave
number of MHD turbulence is of the Kolmogorov type
[209],
and so for strong shocks the acceleration time for protons is
[210]
 |
(30) |
where
 jet
is the jet velocity in units of c, u
is the ratio of turbulent to ambient magnetic energy density in
the region of the shock (of radius R), and B is the total
magnetic field strength. The acceleration process will be
efficient as long as the energy losses by synchrotron radiation
and photon-proton interactions do not become dominant. The
subtleties surrounding the conversion of a particle kinetic energy
into radiation provide ample material for discussion
[208,
211,
212,
213,
214,
215].
The proton blazar model relates
jet
is the jet velocity in units of c, u
is the ratio of turbulent to ambient magnetic energy density in
the region of the shock (of radius R), and B is the total
magnetic field strength. The acceleration process will be
efficient as long as the energy losses by synchrotron radiation
and photon-proton interactions do not become dominant. The
subtleties surrounding the conversion of a particle kinetic energy
into radiation provide ample material for discussion
[208,
211,
212,
213,
214,
215].
The proton blazar model relates
 -ray emission
to the development of electromagnetic cascades triggered by
secondary photomeson products that cool instantaneously via synchrotron
radiation
[208,
211,
212,
213,
214].
The synchrotron loss time for protons is given by
[216]
-ray emission
to the development of electromagnetic cascades triggered by
secondary photomeson products that cool instantaneously via synchrotron
radiation
[208,
211,
212,
213,
214].
The synchrotron loss time for protons is given by
[216]
 |
(31) |
where me, mp,
 T and
T and
 are the electron
mass, proton mass, Thomson cross section, and Lorentz factor,
respectively. The characteristic single photon energy in
synchrotron radiation emitted by an electron is
are the electron
mass, proton mass, Thomson cross section, and Lorentz factor,
respectively. The characteristic single photon energy in
synchrotron radiation emitted by an electron is
 |
(32) |
For a proton this number is (mp /
me)3 ~ 6 × 10⁹
times smaller. High energy
-ray
production through proton synchrotron radiation requires very large,
 (100 G), magnetic
fields. Considering an average cross section
(100 G), magnetic
fields. Considering an average cross section
 p for
the three dominant pion-producing interactions
[217],
p
p for
the three dominant pion-producing interactions
[217],
p
 p
p  0,
p
n
+,
p
p
+
-, the time scale
of the energy losses, including synchrotron and photon interaction losses,
reads
[208]
0,
p
n
+,
p
p
+
-, the time scale
of the energy losses, including synchrotron and photon interaction losses,
reads
[208]
 |
(33) |
where a stands for the ratio of photon to magnetic energy
densities and A gives a measure of the relative strength of
p
interactions versus the synchrotron emission. Note
that the second channel involves the creation of ultrarelativistic
neutrons (but
n
 p) with
mean free path in the observer rest frame given by
p) with
mean free path in the observer rest frame given by
 n =
n
c
n =
n
c  n,
where n ~ 900 s,
is the neutron lifetime. Since
n >
p for
n
p max,
such neutrons can readily escape the system, thereby
modifying the high end of the proton spectrum. Biermann and Strittmatter
[208]
have estimated that
A 200, almost
independently of the source parameters. The most
energetic protons injected in the intergalactic medium will have
an energy that can be obtained by balancing the energy gains and losses
[112]
n,
where n ~ 900 s,
is the neutron lifetime. Since
n >
p for
n
p max,
such neutrons can readily escape the system, thereby
modifying the high end of the proton spectrum. Biermann and Strittmatter
[208]
have estimated that
A 200, almost
independently of the source parameters. The most
energetic protons injected in the intergalactic medium will have
an energy that can be obtained by balancing the energy gains and losses
[112]
 |
(34) |
where
Rkpc  R / 1 kpc.
For typical hot-spot conditions (<B ~ 300 µG,
u ~ 0.5, and
jet
~ 0.3) and assuming that the magnetic
field of the hot spot is limited to the observable region, one
obtains E < 5 × 10²⁰ eV for a < 0.1
[218].
(16) Particles
can also attain ultrahigh energies (E
 1020
eV) within the jets or the AGNs themselves. For instance, the knot A in the
M87 jet, with a length scale l87 ~
2 × 1020 cm, has a magnetic field strength
B87 ~ 300 µG
[219].
Typical AGN sizes are lAGN ~ 1015 cm, and
BAGN ~ 1 G
[220].
Observational evidence suggests that in the jets a << 1,
whereas a ~ 1 for AGNs
[208].
1020
eV) within the jets or the AGNs themselves. For instance, the knot A in the
M87 jet, with a length scale l87 ~
2 × 1020 cm, has a magnetic field strength
B87 ~ 300 µG
[219].
Typical AGN sizes are lAGN ~ 1015 cm, and
BAGN ~ 1 G
[220].
Observational evidence suggests that in the jets a << 1,
whereas a ~ 1 for AGNs
[208].
2.4.3. Cen A: The source of most UHECRs observed at Earth?
Centaurus A (Cen A) is the nearest active galaxy, ~ 3.4 Mpc [221]. It is a complex FRI radio-loud source identified at optical frequencies with the galaxy NGC 5128. Different multi-wavelength studies have revealed that it comprises a compact core, a jet also visible at X-ray frequencies, a weak counterjet, two inner lobes, a kpc-scale middle lobe, and two giant outer lobes. The jet would be responsible for the formation of the northern inner and middle lobes when interacting with the interstellar and intergalactic media, respectively. There appears to be a compact structure in the northern lobe, at the extrapolated end of the jet. This structure resembles the hot spots such as those existing at the extremities of FRII galaxies. However, at Cen A, it lies at the side of the lobe rather than at the most distant northern edge, and the brightness contrast (hot spot to lobe) is not as extreme [222].
Low resolution polarization measurements in the region of the
suspected hot spot give magnetic fields as high as 25 µG
[222].
However, in certain regions where measurements
at both high and low resolution are available, the B-field
amplitude at high resolution can be seen to be twice that at low
resolution. The higher resolution can reveal amplification in the
post-shock region
[223],
yielding B-fields possibly as high as 50 - 60 µG
[224,
225]. The
radio-visible size of the hot spot can be directly measured from
the large scale map
[226],
giving
RHS  2
kpc. The actual size can be larger by a factor ~ 2 because of
uncertainties in the angular projection of this region along the
line of sight.
(17) Then, if
the magnetic field of the hot spot is confined to the visible
region, the limiting energy imposed by the Hillas' criterion is
Emax ~ 1020.6 eV.
2
kpc. The actual size can be larger by a factor ~ 2 because of
uncertainties in the angular projection of this region along the
line of sight.
(17) Then, if
the magnetic field of the hot spot is confined to the visible
region, the limiting energy imposed by the Hillas' criterion is
Emax ~ 1020.6 eV.
Estimates of the radio spectral index of synchrotron emission in
the hot spot and the observed degree of linear polarization in the
same region suggests that the ratio of turbulent to ambient
magnetic energy density in the region of the shock is
u ~ 0.4
[227].
The jet velocity is model dependent: possible values
range from ~ 500 km s-1 to 0.99 c
[222]. For FRI
galaxies, the ratio of photon to magnetic energy densities, a,
is expected to be << 1. Now, by replacing these numbers into
Eq. (34), one can easily see that Cen A can accelerate particles to energies
1020
eV, with a maximum attainable energy set by the Hillas' criterion.
Recent observations of the
ray flux
for energies > 100 MeV by EGRET
[228]
allow an estimate
L ~ 1041erg s-1 for the
source.
(18) This value of
L is consistent with an earlier observation of photons
in the TeV-range during a period of elevated activity
[229],
and is considerably smaller than the estimated bolometric luminosity
Lbol ~ 1043erg s-1
[221].
Data across the entire
ray
bandwidth of Cen A is given in
Ref. [230],
reaching energies as high as 150 TeV
[231],
though data at this energy await confirmation. For values of B
in the µG range, substantial
proton synchrotron cooling is suppressed, allowing the production
of high energy electrons through photomeson processes. The average
energy of synchrotron photons scales as
 0.29
E
[232].
With this in mind, it is
straightforward to see that to account for TeV photons, Cen A
should harbor a population of ultra-relativistic electrons with
E ~ 6 × 10¹⁸ eV. We further note that this would
require the presence of protons with energies between one and two orders
of magnitude larger, since the electrons are produced as secondaries.
(19)
0.29
E
[232].
With this in mind, it is
straightforward to see that to account for TeV photons, Cen A
should harbor a population of ultra-relativistic electrons with
E ~ 6 × 10¹⁸ eV. We further note that this would
require the presence of protons with energies between one and two orders
of magnitude larger, since the electrons are produced as secondaries.
(19)
There are plausible physical arguments
[214,
233]
as well as some observational reasons
[234]
to believe that when proton acceleration is being limited by energy
losses, the CR luminosity
LCR
L. Defining
 , the
efficiency of UHECR production compared to high energy
production
- from the above,
1
- and using equal power per decade over the interval
(Emin, Emax), the source luminosity
is found to be
[235]
, the
efficiency of UHECR production compared to high energy
production
- from the above,
1
- and using equal power per decade over the interval
(Emin, Emax), the source luminosity
is found to be
[235]
 |
(35) |
where L41
luminosity of Cen A / 1041erg s-1
and the subscript "0" refers to quantities at the source.
For fiducial values, B = 0.5 µG,
 = 0.5& Mpc, the diffusive
distance traveled by CRs with E = 1019 eV, is
cD = 50 Mpc
>> d = 3.4 Mpc. Moreover, one can easily check
that for 3.4 Mpc the diffusion
time of any proton with energy above the photopion production threshold is
always less than the GZK-time, and consequently energy losses can be safely
neglected. This implies that the density of protons at the present time
t of energy E
at a distance r from Cen A (which is assumed to be continuously
emitting at a constant spectral rate dNp+n0
/ dE dt from time ton until
the present) can be obtained by solving the Kolmogorov-diffusive-equation,
and is found to be
[236]
= 0.5& Mpc, the diffusive
distance traveled by CRs with E = 1019 eV, is
cD = 50 Mpc
>> d = 3.4 Mpc. Moreover, one can easily check
that for 3.4 Mpc the diffusion
time of any proton with energy above the photopion production threshold is
always less than the GZK-time, and consequently energy losses can be safely
neglected. This implies that the density of protons at the present time
t of energy E
at a distance r from Cen A (which is assumed to be continuously
emitting at a constant spectral rate dNp+n0
/ dE dt from time ton until
the present) can be obtained by solving the Kolmogorov-diffusive-equation,
and is found to be
[236]
 |
(36) |
where D(E) is the diffusion coefficient given in Eq. (7),
x = 4D Ton / r2
Ton /
D,
Ton = t - ton, and
 |
(37) |
For Ton
 , the density approaches
its time-independent equilibrium value neq, while for
Ton =
D,
n / neq = 0.16.
, the density approaches
its time-independent equilibrium value neq, while for
Ton =
D,
n / neq = 0.16.
To estimate the power of Cen A, one can evaluate the energy-weighted approximately isotropic proton flux at 1.5 × 10¹⁹ eV, which lies in the center of the flat "low" energy region of the spectrum,
 |
(38) |
In Eq. (38) we have used the fiducial values of
B and as given in
the previous paragraph, and set
Emin = 1 × 10¹⁹ eV,
Emax = 4 × 10²⁰ eV. As
noted by Farrar and Piran
[235],
by stretching the
source parameters the "low" energy flux from Cen A could be
comparable to that of all other sources in the Universe.
To this end, first fix
L41 I = 0.40, after
comparing Eq. (38) to the observed CR-flux by AGASA:
E3 Jobs(E) =
1024.5 eV2 m-2 s-1
sr-1
[63]. Next,
L41
1, determines
I 0.40, and
consequently the required age of the source
Ton to be about 400 Myr, which appears plausible
[207,
234].
To maintain flux at the "ankle" for the same Ton, one
requires an approximate doubling of LCR at
5 × 10¹⁸ eV. Because of the larger diffusive time delay
at this
energy, this translates into an increased luminosity in the early
phase of Cen A. From Eq. (32), the associated synchrotron
photons are emitted at energies < 30 MeV. The increase in
radiation luminosity in this region is not inconsistent with the
flattening of the spectrum observed at lower energies
[237,
238].
Having identified Cen A to plausibly be a powerful source of UHECRs, we
now explore whether B-field deflections provide
correct directional properties, i.e., sufficient isotropy.
This can be found by computing the incoming current flux density
D  n as
viewed by an observer on Earth, and one finds for a
continuously-emitting source a distribution
~ (1 +
cos
n as
viewed by an observer on Earth, and one finds for a
continuously-emitting source a distribution
~ (1 +
cos )
about the direction of the source, where
is the angle to
the zenith and
)
about the direction of the source, where
is the angle to
the zenith and
 |
(39) |
with x = Ton /
D, and I
as defined in Eq. (37)
[236].
For our choices of B and
, and
Ton = 400 Myr, we
find for E = 1019 eV (E = 1020 eV)
that = 0.04
( = 0.07).
This is in complete agreement with the upper bounds on dipole anisotropies
recently reported by HiRes Collaboration
[62].
One caveat is that the large deflection angle of
the highest energy Fly's Eye event with respect to the line of sight to
Cen A must be explain as a
2 fluctuation
[239].
Additionally, Monte Carlo simulations
[240]
show the predicted auto-correlation function
is not consistent with the clustering at small scale reported by
AGASA Collaboration
[63].
Therefore, if the hypothesis of
CR pairing proposed by AGASA Collaboration is confirmed by future data, it
will constitute a serious objection to the model outlined above.
On the other hand, an interesting observational feature for a Cen A origin
of UHECRs is the possible detection of neutrons, which at the highest
energies could survive decay and produce a spike in the direction of the
source
[236].
The estimated event rate at PAO is about
2 direct events per year, against negligible background.
Thus, in a few years of running, the hypothesis of Cen A as the source of
most UHECRs observed at Earth can be directly tested.
2.4.4. M87: The end of all roads?
M87 is a giant radio galaxy for which there has been
a recent report of a TeV excess at a level of
4
[241].
It is also expected to be a source for GLAST, having an EGRET upper
limit of 2.8 × 10⁻⁸ photons
cm-2 s-1 above 100 MeV (Reimer, private
communication, see also the limit imposed in Ref.
[242]),
and comparable theoretical flux predictions
[244,
243].
M87 was thought as a high-energy CR emitter since quite long ago [245, 246]. At a distance of 16.3 Mpc [247], it is the dominant radio galaxy in the Virgo cluster (l = 282°, b = 74°) [248]. The emission of synchrotron radiation with a steep cutoff at frequencies about 3 × 10¹⁴ Hz from its radiojets and hot spots [249, 250] implies an initial turbulence injection scale having the Larmor radius of protons at 1021 eV.
The major difficulty with a M87 generation of UHECRs is the
observation of the nearly isotropic distribution of the CR arrival
directions. One can again argue that the orbits are bent. However,
the bending cannot add substantially to the travel time, otherwise
the energy would be GZK-degraded. An interesting explanation to
overcome this difficulty relies on a Galactic wind, akin the solar
wind, that would bend all the orbits of the highest energy CRs
towards M87
[251,
252].
Indeed, it has long been expected that such a kind of wind is active in our
Galaxy
[253,
254,
255].
In the analysis of
[251],
it was assumed that the magnetic field in
the Galactic wind has a dominant azimuthal component, with the
same sign everywhere. This is because in a spherical wind the
polar component of the magnetic field becomes negligible rather
quickly, decaying like 1 / r2, and thus the azimuthal
part of the magnetic field quickly becomes dominant, with
B ~
sin / r in polar
coordinates
[256].
Under these
considerations one is left with two degrees of freedom: the
strength of the azimuthal component at the location of the Sun,
and the distance to which this wind extends. Recent estimates
suggest that the magnetic field strength near the Sun is
~ 7 µG
[117].
The second parameter is more uncertain. Our
Galaxy dominates its near environment well past our neighbor, M31,
the Andromeda galaxy, and might well extend its sphere of
influence to half way to M81. This implies an outer halo wind of
~ 1.5 Mpc. With this in mind, the mean flight time of the
protons in the Galaxy is ~ 5.05 × 10⁶ yr
<< s, the
time for straight line propagation from
M87 (Medina Tanco, private communication). The
directions where the 13 highest energy CR
events point towards when they leave the halo wind of our Galaxy
is consistent with an origin in the Virgo region
[251]:
(i) for CR protons, except for the two highest
energy events, all other events can be traced back to within less than about
20° from Virgo; (ii) if one assumes that the two
highest events are helium nuclei, all 13 events point within
20° of Virgo. Arguably, the super-Galactic plane sheet can
focus UHECRs along the sheet. Hence, the particles would
arrive at the boundary of our Galactic wind with the arrival
directions described by an elongated ellipse along the
super-Galactic plane sheet
[257].
This would allow a bending of 20° to be accomodated.
~
sin / r in polar
coordinates
[256].
Under these
considerations one is left with two degrees of freedom: the
strength of the azimuthal component at the location of the Sun,
and the distance to which this wind extends. Recent estimates
suggest that the magnetic field strength near the Sun is
~ 7 µG
[117].
The second parameter is more uncertain. Our
Galaxy dominates its near environment well past our neighbor, M31,
the Andromeda galaxy, and might well extend its sphere of
influence to half way to M81. This implies an outer halo wind of
~ 1.5 Mpc. With this in mind, the mean flight time of the
protons in the Galaxy is ~ 5.05 × 10⁶ yr
<< s, the
time for straight line propagation from
M87 (Medina Tanco, private communication). The
directions where the 13 highest energy CR
events point towards when they leave the halo wind of our Galaxy
is consistent with an origin in the Virgo region
[251]:
(i) for CR protons, except for the two highest
energy events, all other events can be traced back to within less than about
20° from Virgo; (ii) if one assumes that the two
highest events are helium nuclei, all 13 events point within
20° of Virgo. Arguably, the super-Galactic plane sheet can
focus UHECRs along the sheet. Hence, the particles would
arrive at the boundary of our Galactic wind with the arrival
directions described by an elongated ellipse along the
super-Galactic plane sheet
[257].
This would allow a bending of 20° to be accomodated.
Additionally, in order to account for most of the CRs observed above the ankle, the power requirement of Virgo cluster [258] needs a fine-tuning of the source direction relative to the symmetry axis of the wind, so as to turn on magnetic lensing effects [259]. In such a case, M87 could be as high as > 102 times more powerful than if unlensed at energies below E / Z ~ 1.3 × 10²⁰ eV. Criticisms of this model [260] have been addressed in [261].
2.4.5. Other powerful nearby radiogalaxies
Apart from Cen A (which would provide the most energetic particles detectable on Earth), the CR-sky above Auger, if populated by radiogaxies, should be dominated by Pictor A (a strong source with a flat radio spectrum) which would contribute with the larger CR flux [218], and PKS 1333-33 [262]. Other two southern candidates would be Fornax A (z = 0.057) and PKS 2152-69 (z = 0.027), which could provide contributions to the CR flux above the cutoff. For other powerful sources and their properties see [218, 263].
There are two additional EGRET sources, one of them at
high latitude, for which a possible radio galaxy counterpart has
been suggested. One such source is 3EG J1621+8203
(l = 115.5°, b = 31.8°)
[264].
3EG J1621+8203
observations in individual viewing periods yielded near-threshold
detections by EGRET, as for Cen A. However, in the cumulative
exposure, it was clearly detected and the measured flux above 100
MeV was 1.1 × 10⁻⁷ photon cm-2
s-1. The photon spectral index for this source is 2.27±
0.53, steeper than the usual blazar-like spectrum. Mukherjee et al.
[264]
analyzed the X-ray and radio field coincident with 3EG J1621+8203 and concluded that NGC 6251, a bright FRI radio galaxy
[200]
at a redshift of 0.0234 (implying a distance 91 Mpc for
H0 = 75 km
s-1 Mpc-1), and the parent galaxy of a radio jet
making an angle of 45° with the line of sight
[265],
is the most likely counterpart of the EGRET
source. With this identification, the implied
-ray
luminosity is also a factor of 10-5 below that typical of
blazars. Compared with Cen A, the greater distance to NGC 6251
could, perhaps, be compensated by the smaller angle between the
jet and the line of sight.
Combi et al.
[266]
have also recently reported the
discovery of a new radio galaxy, J1737-15, within the location
error box of the low-latitude
-ray source
3EG J1735-1500, whose photon index is
= 3.24± 0.47.
The radio galaxy morphology at 1.4 GHz is typical of the
double-sided FRII. The integrated radio flux is 55.6± 1.5 mJy
at 1.4 GHz, the source
is non-thermal and it is not detected at 4.8 GHz. Using the relation
between approaching and receding jets:
Sappr / Srec = (1 +
cos / 1 -
cos)2 -
,
as well as the radio fluxes of each jet component, a viewing angle
in the range 79° - 86° for a velocity
= v /
c between 0.3 and 0.9 and
= -1 is derived.
Depending on the jet and ambient medium parameters, most
double-sided radio sources have sizes below ~ 300 kpc
[207].
In the case of J1737-15, and using standard
Friedmann-Robertson-Walker models, this size translates into a
possible distance smaller than 350 Mpc. If 3EG J1735-1500 is indeed the result of
-ray
emission in J1737-15, the
intrinsic luminosity at E > 100 MeV, at the distance quoted,
should then be less than 2 × 1044 erg s-1, also
several orders of magnitude smaller than that of blazars. If both
radiogalaxies are closer than 100 Mpc, they could also be relevant
acceleration sites of the observed UHECRs.
2.4.6. Correlations of UHECRs with QSOs, BL LACs, and EGRET sources
Since an alignment beyond random expectations between UHECRs and
QSOs would certainly constitute a great discovery, the possible
correlation between UHECRs and QSOs was subject to a great deal of
scrutiny. In the spring of 1998, Farrar and Biermann pointed out
the existence of a directional correlation between compact
radio-QSOs and UHECRs: all events at the high end of the spectrum
observed by that time, with energy at least
1 above
1019.9 eV, were aligned with high redshifted quasars, a
phenomenon with a chance probability of occurrence less than 0.5%
[47].
Since then, this correlation has been
analyzed several times. Hoffman stated that one of the 5 events
used in the Farrar and Biermann's study, the highest energy event
observed by the Fly's Eye experiment, should not be
included in the UHECR sample under analysis, because this very
same event was considered to introduce the hypothesis
[267].
Without this event, the positive alignment with
random background probability is increased to < 3%, in any case
small enough as to be plausibly significant
[98].
Using an updated event list (twice the size of the previous) from the
Haverah Park
[33]
and the AGASA
[63]
experiments, Sigl et al.
[268]
showed that the statistical significance of the alignment is lowered to
27%. Other authors, however, favored the earlier alignment
[269],
but their correlation signal comes from events with large uncertainty
both in energy and in position: they considered events from the
SUGAR experiment, although it is not clear whether all these events
are above the GZK cutoff. Notwithstanding, after the Haverah
Park energy estimates have been re-assessed
[129],
the original correlation has to be dropped altogether: for the cosmic
rays in question, the energy of the 2 events observed by this
array with incident zenith angle < 45°, that was previously
quoted as > 1019.9 eV at
1, is now shifted
30% downwards, below
the energy cut chosen by Farrar and
Biermann. Hence, independently of the statistical test used, when
considering only the highest energy (> 1019.9 eV at
1) events the
correlation between UHECRs and QSOs is consistent with a random
distribution at the
1 level.
Tinyakov and Tkachev
[270,
271,
272]
reported a correlation between the arrival directions of UHECRs
and BL Lacs. Specifically, the (22) BL Lacs chosen were those
identified as such in the (9th-Edition) Veron-Cetty and Veron
(2000) [273]
catalogue of Quasars and Active Galactic
Nuclei, with redshift z > 0.1 or unknown, magnitude m
< 18, and radio flux at 6 GHz
F6 > 0.17 Jy. This analysis propose no
energy buffer against contamination by mismeasured protons piled
up at the GZK energy limit.
(20) The evidence
supporting their claim is
based on 6 events reported by the AGASA Collaboration (all with
average energy < 1019.9 eV), and 2 events recorded with the
Yakutsk experiment (both with average energy < 1019.6 eV),
which were found to be within 2.5° of 5 BL Lacs contained
in the restricted sample of 22 sources. The chance probability for
this coincidence set-up was claim to be 2 × 10⁻⁵. Here
also the data set used to make the initial assertion is also being
used in the hypothesis testing phase. What is further subject to
critique, is that the imposed cuts on the BL Lac
catalogue were chosen so as to maximize the signal-to-noise ratio,
compensating a posteriori the different cut adjustments by
inclusion of a penalty factor
[275].
Without such arbitrary cuts, the significance of the correlation signal is
reduced at the 1
level. Not to anyone's surprise, even in
acceptance of this approach, the estimated value of the penalty
factor is subject to debate
[275,
272].
Recently, in order to test the hypothetical correlation between
UHECRs and BL Lacs, Torres et al.
[276]
performed a blind analysis using the Haverah Park
[277]
and Volcano Ranch
[278]
data samples.
Such an analysis shows no positional coincidences between these
two samples up to an angular bin > 5°, an angular scale that
is well beyond the error in arrival determination of these experiments
( 3°)
[66].
On the basis of the
strongly correlated sample analyzed by Tinyakov and Tkachev, one
expects the distribution describing the correlation between the
set of BL Lacs and any UHECR data-set with 33 entries to be
Poisson with mean 4.06.
This implies a 2
deviation effect. Alternatively, the 95% CL
interval of the distribution which samples the correlation between
the BL Lacs and CRs recorded by Volcano Ranch + Haverah
Park is (0, 3.09)
[279],
so that the probability to measure the expected mean value
4.06
is << 5%. With this in mind, Torres et
al. [276]
conclude that the 8 coincidences found in the Tinyakov and Tkachev's
analysis do not represent a statistically significant effect.
Additionally, Gorbunov et al.
[280]
claimed that a set of
-ray loud
BL Lacs can be selected by intersecting
the EGRET, the UHECR, and the BL Lac catalogs (all conveniently
cut). The only requirement Gorbunov et al. considered for an
object (here, a BL Lac) to be physically associated with an EGRET
source is that the angular distance between the best estimated
position of the pair does not exceed 2 × R95, where
R95 is the 95% confidence level contour of the EGRET
detection. Torres et al.
[276]
pointed out that identifying EGRET sources with BL Lacs (or any other
object) just by positional pairing within twice the EGRET error
grossly underestimates the goodness of existing
-ray data.
At this stage, it is worth recalling the reader that the typical
R95 radius for EGRET sources is 0.5-1°. One can then
argue that if the confidence contours have any
significance at all, a source should appear beyond the 95%
contour only a few percent of the time. Working with 114 EGRET sources
above | b| > 10°, Punsly
[281]
have estimated the number of random coincidences as a function of the
field radius: ~ 2 (10) quasars with more than 1 Jy of 5 GHz
flux are expected to correlate by random chance if the size of the
typical EGRET angular uncertainty is 0.7° (1.7°), see
Fig. 6.
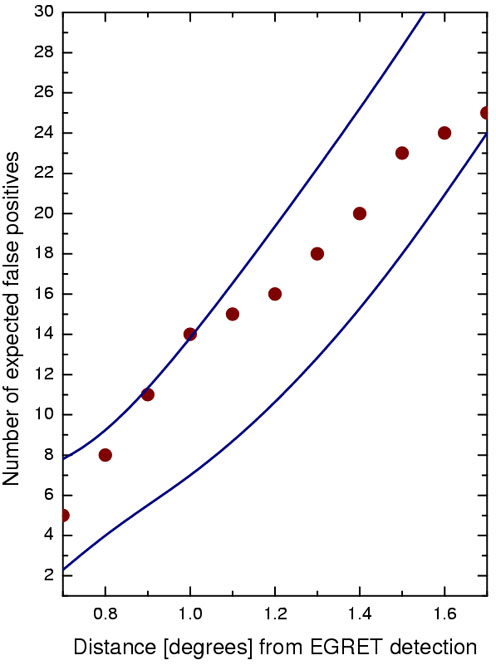 |
Figure 6. The expected distribution of
radio-loud quasars (louder than 0.5 Jy at 5 GHz) to occur by random
chance as a function of the distance from the center of the field for a
sample of 114 EGRET detections. Points represent the number of
|
In our opinion, available statistics on the arrival directions of the UHECRs reveals no significant correlations above random with BL Lacs nor with any other type of quasars, including EGRET blazars.
15 The Faranoff-Riley classification is based on one parameter, RFR, the ratio of the distance between the regions of highest surface brightness on opposite sides of the central galaxy to the total extent of the source. Objects with RFR < 0.5 are classified as FRI, whereas those with RFR > 0.5 are classified as FRII. It is found that the brighter sources are all FRII class, although the distinction between classes is not clear cut in luminosities (for further details see page 220 of Ref. [204]). Back.
16 The shock structure in hot spots is likely to be much more extended than the visible region in the non-thermal radioemission, as suggested by magnetohydrodynamical modeling [218]. Back.
17 For example, an explanation of the apparent absence of a counterjet in Cen A via relativistic beaming suggests that the angle of the visible jet axis with respect to the line of sight is at most 36° [222], which could lead to a doubling of the hot spot radius. It should be remarked that for a distance of 3.4 Mpc, the extent of the entire source has a reasonable size even with this small angle. Back.
18 Note that the received radiation is negligibly affected by interactions with the various radiation backgrounds [215]. Back.
19 Consecutive factors of ~ 2 energy loss
occur in the processes
p
N
0,
0
,
e+
e-.
Eq. (32) then implies proton energies of ~
1020 eV for 100 TeV photons.
Back.
20 The CR sample of Tinyakov and Tkachev consists of 26 events measured by the Yakutsk experiment with energy > 1019.38 eV [274], and 39 events measured by the AGASA experiment with energy > 1019.68 eV [63]. Back.