


Summary. 21 cm observations are reported for the galaxy NGC 5033. Maps with angular resolution of 51" × 85" are presented. The 21 cm continuum map shows a central source and disk emission (~ 1.5 K over 6' extent). The HI distribution roughly follows the optical picture. Both the HI distribution and the velocity field indicate that a major deviation from axial symmetry is present. This deviation can be described in terms of a tilted ring warp model. The irregularities in the morphology of NGC 5033 suggest a tidal origin of the warp.
The galaxy NGC 5033 is a bright galaxy of type SA(s)c (De Vaucouleurs et al., 1976). Its angular size, measured by Holmberg (1958), is 12.3' × 5.8'. Its optical morphology is slightly peculiar in the sense that one of the southern arms has apparently a much higher pitch angle than the other arms. This arm has no obvious counterpart in the northern half of the galaxy. A print of a IIIaJ plate, taken by Van der Kruit and Bosma (1978), is shown in Fig. 1.
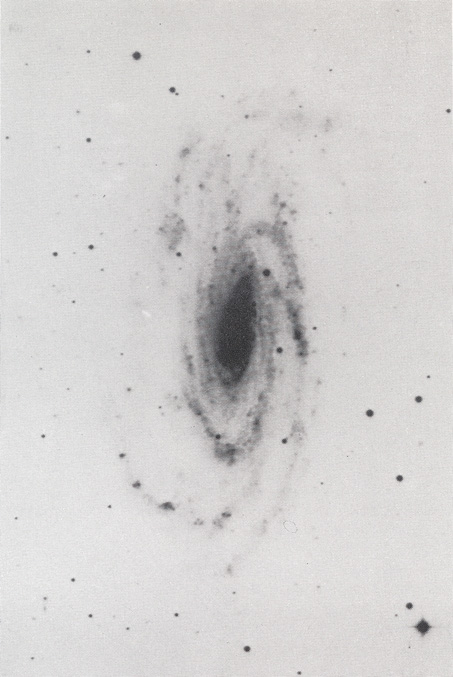 |
Figure 1. Print of a plate (IIIaJ) + Wr2C) of NGC 5033 taken by Van der Kruit and Bosma with the 48-inch Schmidt telescope at Mt. Palomar. |
Little is known about the dynamical properties of this galaxy. Roberts (1968) has measured its integral HI line profile. Ford et al. (1971) studied the rotation of the central region of the galaxy (r < 30"), using two spectra roughly parallel with the major axis. Recently, Van der Kruit and Bosma (1978) studied the velocity field of the central regions up to a radius of 40". They show that the radial velocities are consistent with pure rotation; no major deviations from circular motion are found.
We have observed this galaxy in the 21 cm line with the Westerbork
Synthesis Radio Telescope (WSRT) as part of a program to
determine the distribution and kinematics of the neutral hydrogen
in spiral galaxies of various morphological types
(Bosma, 1978).
The angular resolution of the observations is 51" × 85"
( ×
×
 ),
resulting in a ratio/beamsize of about 8. The HI distribution
roughly extends over the whole optical picture as seen in
Fig. 1.
Both this distribution and the radial velocity field seem to indicate a
slight warping of the plane in the outer parts, similar to
but of smaller amplitude than in M83
(Rogstad et al., 1974).
We
describe the observing procedure and data processing in
section 2,
and present the results in section 3. In
section 4 we present a
simple model of the warp and discuss whether one of the companions
of this galaxy could have caused it during a close passage. We
adopt a distance of 14 Mpc to NGC 5033, based on its radial velocity and
a Hubble constant of 75 km s-1 Mpc-1; 1 arcmin
corresponds to 4.07 kpc.
),
resulting in a ratio/beamsize of about 8. The HI distribution
roughly extends over the whole optical picture as seen in
Fig. 1.
Both this distribution and the radial velocity field seem to indicate a
slight warping of the plane in the outer parts, similar to
but of smaller amplitude than in M83
(Rogstad et al., 1974).
We
describe the observing procedure and data processing in
section 2,
and present the results in section 3. In
section 4 we present a
simple model of the warp and discuss whether one of the companions
of this galaxy could have caused it during a close passage. We
adopt a distance of 14 Mpc to NGC 5033, based on its radial velocity and
a Hubble constant of 75 km s-1 Mpc-1; 1 arcmin
corresponds to 4.07 kpc.
2. Observations and data processing
The observations were made with the WSRT and its 80 channel
filter spectrometer
(Allen et al., 1974).
The system temperature
was 160 K; the filterwidth 129 kHz, corresponding to a velocity
resolution of 27.2 km s-1. Data have been recorded for ten
antenna
spacings ranging from 36 m to 684 m in steps of 72 m. This results
in a synthesized beamwidth of 51" × 85"
( ×
) between halfpower
points, and first grating responses at 10' × 17'. To cover the
radial velocity range of the galaxy four local oscillator settings
were necessary, resulting in 32 channel maps at heliocentric velocities
610 to 1210 km s-1 in intervals of 20 km s-1. The
maps were obtained by application of the standard WSRT system for
calibration and Fourier transformation
(Högbom and Brouw,
1974).
The maps cover an area of 1.5° × 2.5°
( ×
)
and are centred on the nucleus of the
galaxy. The rms noise in each channel map is 0.8 K. Two of the
channel maps were at the same velocity; subtraction of the one from
the other yields residuals with mean 0.0 K and a gaussian distribution
with the expected rms value of 1.15 K. In two other maps one
interferometer was not calibrated; the Fourier transformation was
made without this interferometer. The effect on the maps of this
omission has been corrected with the procedure CLEAN
(Högbom 1974)
At this stage of the data processing the line radiation of the galaxy in each of the maps is still superposed on the continuum radiation from both the galaxy and the background sources. Usually the continuum radiation is separated from the line radiation by averaging an adequate number of line-free channel maps into a continuum map which then is subtracted from the other maps. In our case we had only 4 channels which were certainly line-free. It was felt that subtraction of an average of 4 channels caused too much degradation of the rms noise level (~ 20%). We therefore proceeded as follows.
We first subtracted from each map the only strong background
source, at position
=
13h12m26.3s,
= 36°54'53" ±
3", and amplitude
0.50 ± 0.03 Jy; the influence of all other background
sources is not noticeable in individual channel maps. Then we used
the procedure CLEAN for each channel map to achieve the following:
1) to remove the sidelobes and grating responses in the map, and
2) to correct the baselevel of the map to its proper value i.e.
zero. By these steps we in fact use CLEAN to extrapolate the visibility
function to 0 m; since the extended source structures do not
exceed a diameter of 7' in each of the maps no HI emission should
be missing.
To check this, we have constructed integral HI profiles from our cleaned maps for comparison with integral profiles obtained with single dish telescopes. For NGC 5033 data were available from the 100-m Effelsberg telescope and the 25-m Dwingeloo telescope (Van der Hulst, unpublished). The comparison is shown in Fig. 2. In panels a and b we compare 100-m profiles with profiles at the same position derived from our maps by appropriate corrections for the primary beams of the 100-m telescope and the WSRT 25-m elements. The agreement is not very good: we believe that this is caused by baseline variations in the 100-m profiles which are sometimes indistinguishable from genuine HI signal. In panel c we have integrated both the Bonn profiles and our WSRT maps to construct a total HI, profile corrected for the effects of the primary beams. Again the agreement is not so good, for the same reason as stated above. Finally, in panel d we compare the WSRT profile with the Dwingeloo profile at the same position. The disagreements here are caused by pointing errors and calibration problems of the Dwingeloo observations. The problematic status of the single dish comparison data prevents us from assessing properly whether we have missed any HI emission in our maps. A careful and elaborate study, however, including many corrections for minor calibration problems, of a few galaxies of similar angular size as NGC 5033 with the Dwingeloo telescope indicates that very little (< 10%) HI has been missed in the WSRT observations of those galaxies (Allen and Shostak, priv. comm.). We therefore think that our reduction procedures lead to typical uncertainties of at most 5 to 10% in the integral HI profile.
 |
Figure 2. Comparison of integral HI profiles (see text). Full curves: WSRT profiles, dashed curves: Effelsberg 100-m profiles, dotted curve: Dwingeloo 25-m profile. |
The cleaned maps still contain line and continuum radiation. These have been separated with the window method, described by Bosma (1978). In this method we determine for each profile individually its baselevel (representing the continuum radiation), the area under the profile after subtraction of the continuum, and the intensity weighted mean velocity. This gives us at once a map of the continuum radiation, a map of HI column densities, a radial velocity field and 32 line channel maps. Since the method uses an acceptance gate in velocity rather than in intensity we avoid the biases extensively discussed by Rots and Shane (1975). An important advantage is that we use on the average more channels for the continuum than we would have done if we had used the line-free channel maps to form a continuum map (~ 24 versus 4).
We have further processed the 21 cm continuum map by removing
a few weak background sources and their instrumental responses.
The quality of the map is not very high: around one of the weak
sources there is a spurious ring with radius
5' × 5'csc, while
parts of the grating responses of other sources cannot be removed.
These effects, which are at low level, are instrumental and indicate that the instrument was not entirely stable during the four 12 hour periods. The final map of the 21 cm continuum radiation of the galaxy is presented in Fig. 3, superposed on the IIIaJ print. The rms noise in this map is of course variable, owing to the varying number of channels used (see section 2); the mean value is about 0.2 K. There is an extended source coinciding with the central region of the galaxy, with a peak brightness of 15 ± 1 K. After subtraction of this source, the mean brightness temperature of the disk, determined over the area out to. the last contour in Fig. 3, is 1.5 K. The observed total flux density of the galaxy at 21 cm is 220 ± 10 mJy.
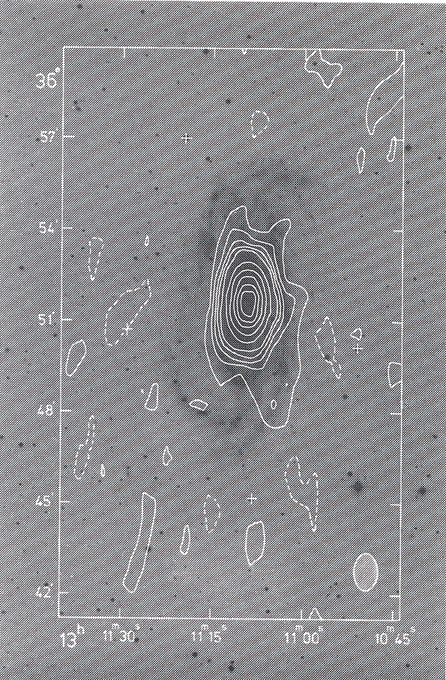 |
Figure 3. Map of the 21 cm continuum radiation, superimposed on the IIIaJ print. The contours are -0.45 (dashed), 0.45, 0.9, 1.35, 1.8, 2.25, 4.5, 6.75, 9.0, 11.25 and 13.5 K. |
The channel maps containing line radiation are shown in Fig. 4. The lack of symmetry in most of the maps indicates that NGC 5033 is not a simple inclined disk in differential rotation. The map of the HI distribution, corrected for the primary beam attenuation, superposed on the IIIaJ print, is presented in Fig. 5. The rms noise in this map is variable, because of the varying number of channels in the summation. For most of the points it is about 5 × 10¹⁹ atoms cm-2; in the central parts, where the profiles are much broader, it is about 1020 atoms cm-2.
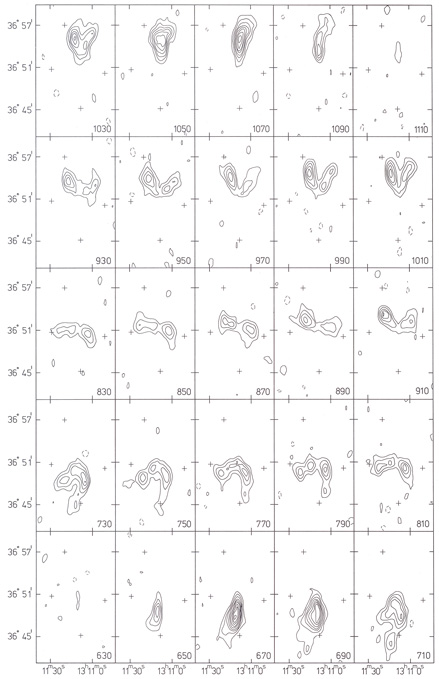 |
Figure 4. Maps of the 21 cm line radiation. Contours units are 1.86 K, dashed contours are negative. The heliocentric velocity (in km s-1 of each channel map is indicated in the lower right corner; the crosses refer to star positions. These maps have not been corrected for the primary beam. |
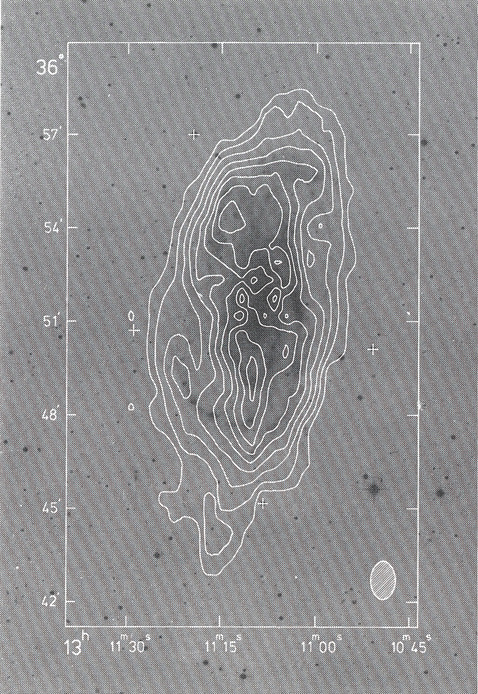 |
Figure 5. Map of the HI column density distribution of NGC 5033, superimposed on the IIIaJ print. The contour interval is 2.17 × 10²⁰ atoms cm-2, the first contour is at 2.17 × 10²⁰ atoms cm-2. |
Several features are noteworthy in this map. The extent of the
HI distribution is roughly the same as the extent of the optical
features. The orientation of the contours, especially when they are
smoothed, changes as function of radius. In the inner parts the
position angle of the major axis makes an angle of ~ 15° with the
north-south line. This change of orientation seems to be present in
the optical picture as well. The peculiar arm, running from south
to east, stands out as a separate feature in the HI map. A southern
extension, at
= 36°44', does not
coincide with visible optical emission.
The spatial resolution of our observations is insufficient to
see whether the HI is closely related with bright optical features
other than the peculiar arm. There is apparently no central depression,
as has been observed in many other galaxies. In the present
case, however, with a ratio radius/beamsize of about 8, a central
depression and a ringlike HI distribution peaking around a radius
of 2' (~ 8 kpc) would be severely smoothed out by beam broadening.
The course resolution also prevents the study of HI absorption in
front of the continuum source. The total HI mass in the map is
1.0 × 10¹⁰
M , if
the gas is optically thin.
, if
the gas is optically thin.
The profiles at each point have a simple shape with one peak; in the central parts they are broader than elsewhere. The accuracy of the intensity weighted mean radial velocities at each point is better than 10 km/s. The map of the radial velocity field is shown in Fig. 6, superposed on the IIIaJ print.
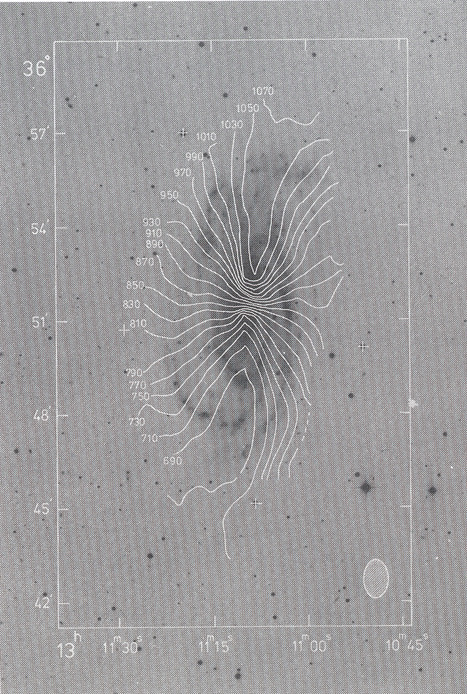 |
Figure 6. Map of the radial velocities in NGC 5033, superimposed on the IIIaJ print. The numbers indicate heliocentric velocities in km s-1. |
We note a few peculiarities, which indicate deviations from circular motion. The position angle of the major axis, i.e. the line of extreme radial velocities, changes when going radially outwards. This change is particularly large at the southern side; perhaps this is associated with the peculiar arm discussed above. An asymmetry can be noted between the northern and the southern half. of the velocity field, especially along the major axis.
The gradual change of the position angle of the line of nodes is similar to the change in orientation of the contours in the HI map. Since the latter is correlated with the optical picture there is a strong suggestion that we are tracing here a major dynamical phenomenon in this galaxy. The other, smaller deviations are asymmetric in character. Owing to the coarse resolution in space and velocity we cannot study the peculiar arm (nor any other arm) in any detail. In the channel maps (Fig. 3) it does not stand out clearly as a separate feature there; rather it takes part in the general rotation of the galaxy.
The gradual change with radius of the position angle of the
line of nodes is similar to, but of much smaller amplitude than,
that observed in the galaxy M83
(Rogstad et al., 1974).
In the
following, we assume that this change is due to a change in the
orientation of the plane of the galaxy in space. We approximate
this by treating the galaxy as a set of concentric rings; in each
ring we assume circular motions only. For the position of the dynamical
centre we take the optical position given by
Gallouet et al. (1973):
=
13h11m10.84s,
= 36°51'45"
(1950.0). From the symmetric
central.parts of the velocity field we derive a systemic velocity
of 875 ± 5 km s-1. This value is close to the value of
881 ± 5 km s-1 found by
Van der Kruit and Bosma
(1978)
from optical spectroscopy. For each ring we have calculated the mean
circular velocity,
Vc, and the dispersion around this mean, for a given
set of orientation angles of the major axis of the ring,
 , and the
inclination
angle, i. The final values of Vc,
and i are chosen
such that the
dispersion around the mean Vc is a minimum. In
Fig. 7 a-d we show the solution for
, i,
Vc and the projected HI surface density,
, and the
inclination
angle, i. The final values of Vc,
and i are chosen
such that the
dispersion around the mean Vc is a minimum. In
Fig. 7 a-d we show the solution for
, i,
Vc and the projected HI surface density,
 H for rings
of 1' width.
H for rings
of 1' width.
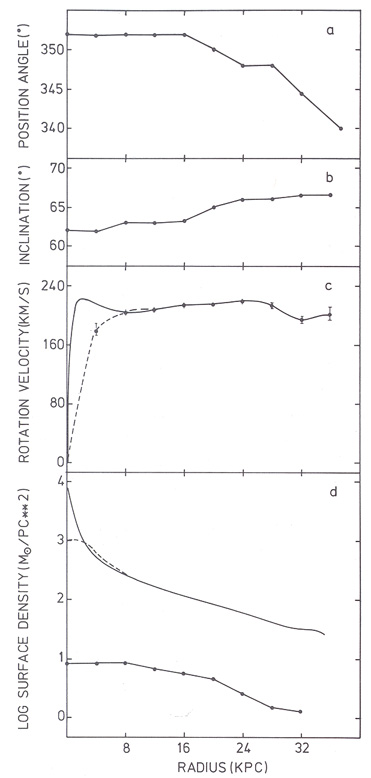 |
Figure 7. Radial distributions of position angle of the major axis (panel a), inclination (panel b), rotation velocity (panel c), and surface densities of total mass and HI gas mass (panel d). The dashed lines in panel c and d refer to the 21-cm points only. |
From the data in Fig. 7 we have computed a model
velocity
field and HI distribution by applying the appropriate orientation
corrections. The results are presented in Fig. 8.
Comparison with
Figs. 5 and 6 shows that
we indeed reproduce the change in position
angle of the major axes of the velocity field and of the HI
contours. Therefore we conclude that this simple model can describe the
main deviation from circular motion found in NGC 5033. We can, however,
not reproduce the asymmetries described in
section 3. The
orientation parameters in the central regions (out to 4' radius) are
consistent with the parameters derived by
Van der Kruit and Bosma
(1978)
for the inner 40", where they found
= 353° ± 3°
and i = 66° ± 4°.
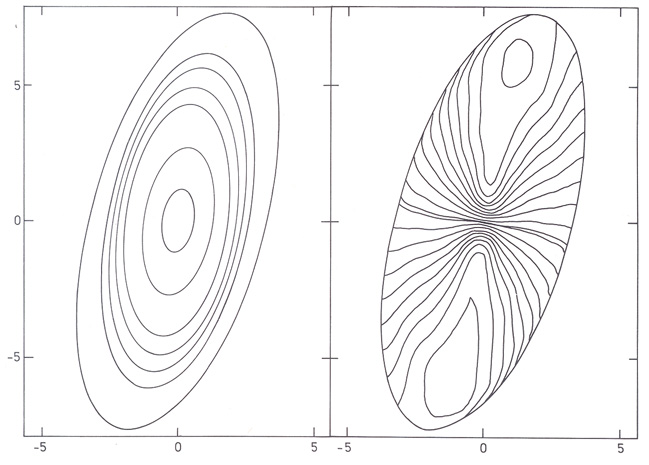 |
Figure 8. The HI contour shapes (left) and radial velocity field (right) resulting for the tilted ring model described in the text The contour unit in the velocity map is 20 km s-1. Around the minor axis the contours 15, 0 and -5 km s-1 are shown. |
We have considered two alternative causes for the deviations from axial symmetry in NGC 5033. Perhaps, as has been emphasized by Mark (priv. comm.), the peculiar arm is simply a co-planar one armed spiral mode; then the deviations might arise from streaming motions in the gas caused by the presence of this mode. In that case, however, we expect that the coarse resolution would have smoothed out these motions, similarly to the smoothing of the expected streaming motions associated with the two armed spiral pattern. Another possibility is that the gradual change in the major axis position angle is similar to that found in NGC 4736 (Bosma et al., 1977), where it has been interpreted as being caused by an oval distortion in a flat disk. The alignment of the optical and HI contours with the change in the velocity field in NGC 5033 suggests that no bar or oval distortion is present in this galaxy. We think it most likely that the main deviation from axial symmetry in NGC 5033 is due to a warping of the plane.
b) Rotation curve and mass modal
From the orientation parameters given in Fig. 7
we find that
the outermost ring, at radius 36 kpc, bends up to ~ 6 kpc from the
main plane. It is possible that the line of sight component of the
velocity vector in the outer rings consists of components other than
the projected circular velocity, especially z-motions. Since we do
not know whether this is true, we have assumed that the curve in
Fig. 7c is the rotation curve of the galaxy. The
beam broadening in the
inner parts makes the 21-cm point at 1' radius unrealistic. A better
estimate for
Vc(r) in this region comes from the
H
velocities measured by
Van der Kruit and Bosma
(1978).
Their resulting Vc(r) is
included in the full line in Fig. 7c. Note,
however, that there is a
gap of reliable information between 40" and 2' radius.
From the rotation curve we have computed a mass model using the
method outlined by
Nordsieck (1973).
He has expanded Toomre's disk method
(Toomre, 1963)
in a mathematically convenient way (we used
his formula 10). Although the assumption of a thin flat disk contradicts
our contention that NGC 5033 has a warped plane, we still proceed in
this manner to get a rough estimate of the mass distribution.
The resulting curves of the mass surface density,
M(r),
for both the
21-cm points alone and for the rotation curve including the optical
data are shown in Fig. 7d. Quite clearly the
addition of the optical
points leads to a more pronounced central mass concentration. The
total mass out to 36 kpc, Mo, is
2.7 × 10¹¹
M.
This leads to values for
MH / Mo of 0.037,
MH / LB of 0.41 and
Mo / LB of 10.5. We have also
made a model fit to the rotation curve using the models employed by
Roberts et al. (1975).
We can quite successfully reproduce the curves
of Fig. 7c and d with two spheroids in the inner
parts and a flat
disk containing 92% of the mass. The total mass in the fit is
Mfit = 4.4 × 10¹¹
M. About
40% of the mass in the model lies beyond
the last observed point on the rotation curve. The ratio of mass-to-HI
gas surface density is roughly constant beyond 12 kpc radius, at a level
of 27 ± 4.
Several questions remain to be discussed after the construction of the models discussed above. The internal contradiction between the warp model and the thin disk mass model is disturbing. Perhaps, an alternative mass model, including an extended spheroidal component, is more appropriate. The number of unknowns in such a model will be large: apart from the assumptions on the rotation velocities in the outer parts (whether or not Vc(r) in Fig. 7c is the rotation curve), the ratio of spheroidal mass to disk mass has to be guessed. We did not attempt to construct such a model.
If NGC 5033 has a warped plane then the physical maintenance of this warp has to be considered. Hunter and Toomre (1969) showed that a ringlike warping of a self gravitating disk will damp our rather quickly due to the differential precession of each ring. The timescale for which a warp can last is in the order of 2 × 10⁹ years at most. A warp seen now in a massive galaxy like NGC 5033 must then have been caused recently, perhaps by a close passage of another galaxy. Recent 21 cm observations of several galaxies, however, indicate that for some galaxies the HI layer is warped while no reasonably-sized other galaxy is sufficiently close to have caused this warp (Rogstad et al., 1974; Sancisi, 1976; see also Bosma, 1978). These observations suggest that one or more of the initial conditions in Hunter and Toomre's analysis is not fulfilled for these galaxies. The striking difference between the warp in NGC 5033 and those in the galaxies indicated above is that in NGC 5033 the warping starts well within the Holmberg radius.
The presence of the warp in the optical picture, the asymmetry in the velocity field and the ragged appearance of the galaxy can be used to argue that the warp in NGC 5033 has been excited recently as a result of a tidal interaction. we have assembled a list of candidate neighbouring galaxies by taking those galaxies within a 3° circle of NGC 5033 having redshifts between about 300 and 1400 km s-1. Three galaxies stand out as being rather close: NGC 5005, NGC 5014 and Ho VIII. A few relevant properties of these three galaxies are listed in Table l. The total masses of these galaxies are not well known; we have estimated them from the luminosity and a mass-to-blue light ratio of 10. The masses of NGC 5014 and Ho VIII are small compared to that of NGC 5033. If they have excited a warp in NGC 5033, it seems likely that NGC 5033 in turn must have damaged these galaxies severely. On the IIIaJ plate however, none of these galaxies looks very distorted. The remaining candidate for tidal interaction is then NGC 5005, at a projected distance of about 170 kpc. This galaxy, however, does not look distorted either.
| Galaxy | Type | BTo | LB(109
L) |
V(km s-1, heliocentric) | Distance
 D from N 5033
(') D from N 5033
(') |
| NGC 5033 | SA(s)c I-II | 10.18 | 25.6 | 875 ± 5 | -- |
| NGC 5005 | SAB(rs)bc II | 10.19 | 25.4 | 1015 ± 26 | 42.5 |
| NGC 5014 | (Mark. 449) | (13.21)† | 1.6 | 1105 ± 71 | 28.3 |
| Ho VIII | IAB(s)m | 13.36 | 1.4 | 957 ± 10 | 23.1 |
| * All entries, except V(N
5033) and D,
from
De Vaucouleurs et
al. (1976) |
|||||
| † Nilsson's (1973) value of 13.5 corrected with Shostak's (1978) relation. | |||||
We have mapped the galaxy NGC 5033 in the 21 cm line with an angular resolution of 51" × 85". The HI distribution roughly corresponds to the optical picture. From both the HI distribution and the velocity field we conclude that this galaxy does not fit the picture of an inclined disk in differential rotation. We have shown that the main deviations from circular motion can be described by a warping of the plane at larger radii. The warping cannot be a very regular one because of the observed asymmetries in this galaxy. We argue that a recent tidal interaction with one of the galaxy's neighbours, possibly NGC 5005, could have-produced the warp. A summary of the derived quantities for NGC 5033 is presented in Table 2.
| Position (1950.0) | a = 13h11m10.84s,
= 36°51'45'' |
| Size (Holmberg, 1958) | 12.3' × 5.8' |
| Adopted distance | 14 Mpc |
| Luminosity | 2.56 × 10¹⁰
L |
| HI mass | 1.0 × 10¹⁰
M |
| Total mass, Mo, out to 36 kpc | 2.7 × 10¹¹
M |
| MHI / Mo | 0.037 |
| MHI / LB | 0.39 |
| Mo / LB | 10.5 |