


Summary. 21 cm HI line observations are reported for the galaxy NGC 5055. Maps with angular resolution of 49" × 73" are presented. The 21 cm continuum radiation extends over the bright optical disk (~ 10') in diameter). The HI distribution extends to twice the Holmberg diameter of 16' × 10.1'. Both the HI distribution and the radial velocity field indicate that NGC 5055 has a warped disk. The asymmetries in the light distribution in the outer parts of NGC 5055 do not correlate well with the HI distribution. HI emission has been detected from UGC 8313, a small galaxy 26' away from NGC 5055; this galaxy is probably a true companion. The warp makes the determination of the rotation curve of NGC 5055 problematic. There is some evidence that NGC 5055 might have a dark component in the mass distribution. The origin and maintenance of the warp is puzzling.
NGC 5055 is a large galaxy of type SA(rs)bc (De Vaucouleurs et al., 1976); its optical dimensions are 16' × 10.1' (Holmberg, 1958). It has a spiral arm structure which shows a multiple arm pattern, rather than two distinct arms like in M81. This pattern is made up of luminous regions intermixed with dust patches. The arms cannot be followed continuously for more than about 300 in the azimuthal direction (Sandage, 1961; see also Fig. la). On deep exposures, such as Fig. 1b, which is a print of a IIIaJ-plate taken by Van der Kruit and Bosma with the 1.2 m Schmidt telescope at Palomar Mountain, the galaxy looks less regular. A primary absorption lane in the southern half crosses the face of the galaxy. A region of patchy emission occurs at ~ 9' SW of the nucleus. Very weak emission features can be seen even farther out.
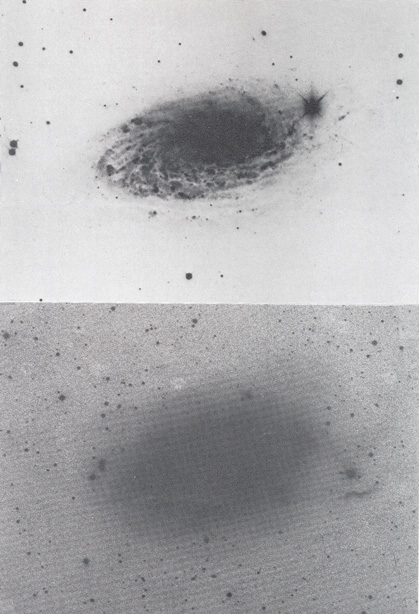 |
Figure 1. Photographs of NGC 5055: a short exposure photograph taken at Hale Observatories (upper), and a IIIaJ print by Van der Kruit and Bosma (Van der Kruit, 1978) with the Palomar Schmidt telescope (lower). |
This galaxy has been the subject of a variety of studies. Lindblad and Delhaye (1947) and later Fish (1961) studied the luminosity distribution in the inner parts (out to 150" radius). Burbidge, Burbidge and Prendergast (1960) derived a rotation curve from optical spectroscopy of HII-regions. Rogstad, Rougoor and Whiteoak (1967) observed this galaxy in the 21 cm line with a single spacing interferometer. They derived a rotation curve very much different from the one found by Burbidge et al.. Van der Kruit and Bosma (1978) studied the velocity field of this galaxy in the inner parts (< 60" radius). They found that the velocities are consistent with circular motion, but the rotation curve has a lower maximum velocity than measured by Burbidge et al..
We have mapped this galaxy in the 21 cm line, with the Westerbork Synthesis Radio Telescope (WSRT), as part of a program to determine the distribution and kinematics of the neutral hydrogen in spiral galaxies of various morphological types (Bosma, 1978a). The angular resolution (49" × 73") is insufficient to study the multiple arm structure itself, but in principle we can determine an accurate rotation curve beyond 1' radius. The results are rather surprising: the galaxy is about twice as big in HI as the Holmberg diameter.
The outer layers seem to have an orientation in the sky that differs considerably from the optical picture: In section 2 of this paper we describe the observations and data processing. The results are presented in section 3, and discussed in section 4. We will show that the observations indicate that NGC 5055 is warped in its outer parts. Since NGC 5055 does not have massive companions, the origin of the warp is puzzling.
2. Observations and data processing
The observations have been made with the WSRT and its 80 channel filter
spectrometer
(Allen.et al., 1974).
Measurements were
taken at 20 spacings ranging from 36 m to 720 m in steps of 36 m.
This resulted in a synthesized beamwidth of
49" × 73" ( ×
×
 ), and
a first grating response at 20' × 29'. To cover the radial velocity
range of the galaxy four settings of the local oscillator were
necessary. In this way 32 velocity channels were obtained in the range
200 km s-1 to 800 km s-1 (heliocentric), at
intervals of 20 km s-1.
The halfpower width of one filter corresponds to 27.2 km
s-1. Maps
were produced by application of the standard WSRT procedures for
calibration and Fourier transformation
(Högbom and Brouw,
1974).
The rms noise level in each channel map is about 0.5 K. Two of the maps
were at the same velocity; subtracting the one from the other yielded
a map of residuals with mean zero and gaussian noise statistics.
), and
a first grating response at 20' × 29'. To cover the radial velocity
range of the galaxy four settings of the local oscillator were
necessary. In this way 32 velocity channels were obtained in the range
200 km s-1 to 800 km s-1 (heliocentric), at
intervals of 20 km s-1.
The halfpower width of one filter corresponds to 27.2 km
s-1. Maps
were produced by application of the standard WSRT procedures for
calibration and Fourier transformation
(Högbom and Brouw,
1974).
The rms noise level in each channel map is about 0.5 K. Two of the maps
were at the same velocity; subtracting the one from the other yielded
a map of residuals with mean zero and gaussian noise statistics.
The channel maps contain both line and continuum emission. No strong background point sources are present in the maps. By inspecting the maps it was found that four channels at the low velocity side and four channels at the high velocity side do not contain any line radiation. We have averaged these eight maps to form a map of the 21 cm continuum radiation. This map subtracted from all other channel maps which now contain line emission only.
The line emission of NGC 5055 extends to quite large distances from the centre, almost to twice the Holmberg radius of 8'. This caused several difficulties in the data processing. Firstly, although the grating responses occur at 20' × 29', line signal in channel maps at low velocity occurs at the same position as grating responses in several other channel maps at high velocities and vice versa. This results in profiles which have an irregular velocity baseline outside the genuine signal. Secondly, with the shortest spacing at 36 m, we cannot properly measure source structures of an angular size larger than about 12'. The galaxy is so large in HI that we can expect such structures to be present. Moreover, the chosen interferometer configuration gives maps with a negative base level, which again results in profiles with an irregular velocity baseline. As in the cases NGC 5033 and NGC 3198 (Bosma, 1978a) we have tried to solve these problems with the procedure CLEAN (Högbom, 1974). After cleaning remnants of the grating responses were still present; also the base level of the maps was still negative outside the source, although the amplitudes of these effects were small. This means that there is indeed a component in the HI distribution with an angular size larger than 12'. To estimate the amplitude of this component we have determined the mean base level of the cleaned maps in the areas outside the line emission, but inside the first grating response. These levels are negative just because of the missing HI component. Therefore we added their absolute values to the parts of the maps inside the grating responses. The other parts of the maps were set to zero. The channel maps thus corrected should contain all the HI emission. The maps of the HI distribution and of the radial velocity field have been calculated from the corrected channel maps with the window method described elsewhere (Bosma, 1978a).
It might be argued that our method to correct for the missing short-spacing information is in principle not the best one. A better alternative would be to measure the missing information with a large single dish telescope and to add it in a proper way into our interferometer maps. We had at our disposal several spectra taken with the 25 m Dwingeloo telescope and the Effelsberg 100 m dish (Van der Hulst et al., private communication). These spectra, however, suffered from the problem that the velocity baselines are not sufficiently flat. As in the case of NGC 5033 (Bosma, 1978b), we have decided not to use these data, since this would have introduced unknown errors into the base levels of the maps. Instead, as a check of the procedure adopted, we have constructed from our corrected maps sample spectra centred at the same positions as the single dish data. The agreement is rather good for those positions where the signal is strong. We conclude from this that we do not miss significant information in our maps; only the details of a very extended, low-amplitude HI component (size 12' or more) might differ from what we have adopted.
The map of the 21 cm continuum radiation has been processed further by subtracting a number of background point sources with their grating responses. The resulting map of the 21 cm continuum emission from NGC 5055 has a lower resolution than the map published by Van der Kruit (1973) (49" × 73" vs 25" × 36"), but the latter contains larger instrumental errors. A detailed discussion of the radio continuum properties of NGC 5055, including a map of the spectral index distribution between 610 and 1418 MHz, will be deferred to another paper (Hummel and Bosma, 1978). We note here, however, that the radio continuum radiation extends only over the bright optical disk of NGC 5055.
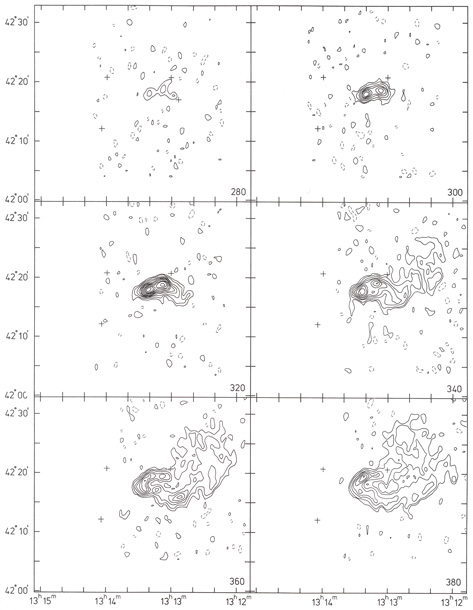
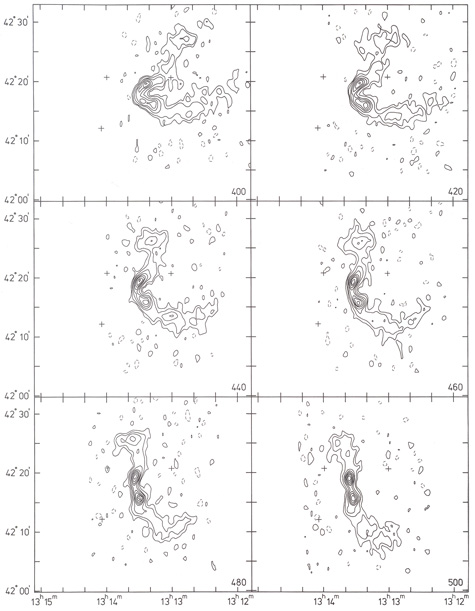
In Fig. 2 we present plots of the corrected channel maps. The lack of symmetry in most of these maps indicates that NGC 5055 cannot be described as a flat disk in differential rotation. In Fig. 3 we present the map of the HI column density distribution, super-imposed on a print of a red 127-04 plate taken by Van der Kruit and Bosma with the Palomar Schmidt telescope. The rms noise in this map is of course variable, due to the varying number of channels used in the summation; in most areas it is about 5 × 10¹⁹ atoms cm-2.
 |
 |
 |
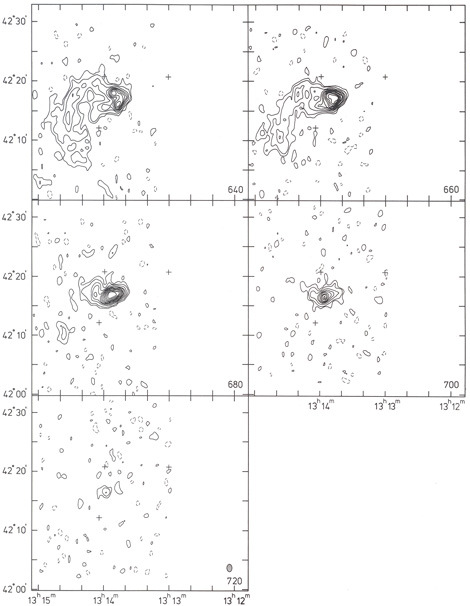 |
Figure 2. Maps of the 21 cm line radiation. Contours are -0.67 K, 0.67 K, 1.35 K and multiples of 1.35 K. The heliocentric radial velocity (in km s-1) of each map in indicated in the lower right corner. These maps have not been corrected for the primary beam. |
 |
Figure 3. Map of the HI column density distribution in NGC 5055, superimposed on a red 127-04 print, taken by Van der Kruit and Bosma with the Palomar Schmidt Telescope. The dashed contour is 1.3 × 10²⁰ atoms cm-2; the other contours start at 2.6 × 10²⁰ atoms cm-2 with interval 2.6 × 10²⁰ atoms cm-2. |
We note the following characteristics in this map:
The HI distribution extends to large distances from the centre of the galaxy. Although some patchy optical emission features can be seen far out, there is little or no correlation between the outermost HI and the light distribution.
The region of optical emission at
=
13h12m50s,
= 42°16'
coincides with a peak in the HI distribution.
The smoothed-out HI contours change their orientation with radius. The inner contours have the same position angle and more or less the same inclination as the inner optical disk, while the position angle of the outer HI contour differs by 15°.
There is a rather sudden drop of HI surface density outside the bright optical disk.
There is a notable asymmetry in the outer HI distribution: the ridge on the northern side does not have a counterpart at the other side. Also the almost straight dust lane at the southern side of the galaxy has no obvious counterpart in the HI distribution in Fig. 3.
With the present resolution we do not find a notable lack of HI emission in the central parts of the galaxy, although there is a slight depression.
Integration of the channel maps yields a total HI mass of 8.1 ×
109
M . In
this calculation we have assumed a distance to
NGC 5055 of 8.0 Mpc, derived from the systemic
velocity and a Hubble constant of 75 km s-1 Mpc-1.
. In
this calculation we have assumed a distance to
NGC 5055 of 8.0 Mpc, derived from the systemic
velocity and a Hubble constant of 75 km s-1 Mpc-1.
Inspection of the channel maps and the profiles leads to the conclusion that all the profiles have a simple shape with one peak. Therefore the calculated intensity weighted mean velocities have an uncertainty of 10 km s-1 or less. The velocity field is shown in Fig. 4, again superimposed on the red photograph. In the inner parts the lines of equal radial velocities are consistent with those for a flat galaxy in differential rotation with an orientation given by the position angle and inclination of the bright optical disk. At larger radii the position angle of the kinematical major axis, i.e. the line of extreme radial velocities, changes from 1000 to about 900 and then back to about 115°.
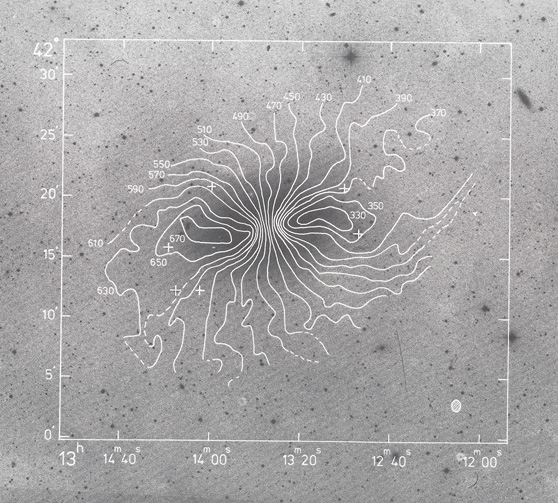 |
Figure 4. Map of the radial velocities in NGC 5055, superimposed on a red 127-04 print, taken by Van der Kruit and Bosma with the Palomar Schmidt Telescope. The numbers indicate heliocentric velocities in km s-1. |
At first sight the deviations from axial symmetry in the velocity field are by themselves symmetric. At the southern side, however, the contour of the kinematical minor axis does not change so abruptly as on the northern side; the same holds for the neighbouring contours. This deviation from central symmetry between the northern and southern side is also found in the HI distribution (cf. section 3b point 5). The peculiar features in the HI distribution (3b point 2, 4 and 5) do not stand out separately in the velocity field.
d) Detection of HI in UGC 8313
Inspection of the channel maps revealed a marginal detection of
neutral hydrogen in UGC 8313, i.e. the small galaxy at
=
13h11m6s,
= 42°28'. An
integrated profile is shown in Fig. 5. Since its
systemic velocity, V = 630 ± 10 km s-1, differs
only 130 km s-1 from that of NGC 5055 we believe it to be a true companion. If we
assume a distance of 8.0 Mpc, the dimensions of this galaxy are
5 × 1 kpc, its total mass about 109
M and
its hydrogen mass is 3.5 × 10⁷
M.
Nilsson (1973)
lists an apparent magnitude of 14.9; this results in
LB = 2.0 × 10⁸
L if we
use Shostak's relation
(Shostak, 1978)
to correct from
Zwicky-magnitudes to De Vaucouleurs-magnitudes. Thus
M / LB
 5,
MH / LB
0.18 and
MH / MT = 0.04; these are
values typical for earlier type spirals.
De Vaucouleurs et
al. (1976)
have tentatively classified this galaxy as SB(s)c. From the velocity
difference and the projected distance of UGC 8313 to NGC 5055 we
estimate that a lower limit to the mass of the latter galaxy is
2.4 × 10¹¹
M.
5,
MH / LB
0.18 and
MH / MT = 0.04; these are
values typical for earlier type spirals.
De Vaucouleurs et
al. (1976)
have tentatively classified this galaxy as SB(s)c. From the velocity
difference and the projected distance of UGC 8313 to NGC 5055 we
estimate that a lower limit to the mass of the latter galaxy is
2.4 × 10¹¹
M.
 |
Figure 5. Integral HI profile of UGC 8313. The rms noise is about 25 mJy. |
The changes of orientation of the HI contours and in the radial
velocity field of NGC 5055 are similar to those observed in the
galaxy M83
(Rogstad et al., 1974).
We have therefore tried to
describe the observations in terms of a ring model similar to that
of M83. We divide the galaxy into concentric annuli of
1' width and
allow each annulus to have its own orientation in the sky. The
orientation of the annuli can be described by the position angle of
the line of nodes,  and the
inclination, i. We have computed from
the velocity field for a given set of values for
and i the mean
circular velocity, Vc, in each annulus and the
dispersion around this mean. As final values of Vc,
and i for an annulus
we adopt those values for which this dispersion is a minimum. We have also
computed the radial distribution of the surface density of neutral
hydrogen,
and the
inclination, i. We have computed from
the velocity field for a given set of values for
and i the mean
circular velocity, Vc, in each annulus and the
dispersion around this mean. As final values of Vc,
and i for an annulus
we adopt those values for which this dispersion is a minimum. We have also
computed the radial distribution of the surface density of neutral
hydrogen,  H,
(i.e. column density times cos i) for each annulus.
The results are given in Fig. 6a-d. In the
calculations we have
assumed for the position of the rotation centre the optical position
given by
Gallouët et
al. (1973):
=
13h13m35.1s,
= 42°17'48",
(1950.0) and a systemic velocity of 500 ± 5 km s-1 which
follows the symmetry of the velocity field in the inner parts about the
optical centre. With the parameters in
Fig. 6 we have calculated a
model HI distribution and velocity field. These are shown in
Fig. 7.
Comparison with Figs. 3 and
4 suggests that we can indeed describe
the major symmetry in the observations with this kind of warp model.
H,
(i.e. column density times cos i) for each annulus.
The results are given in Fig. 6a-d. In the
calculations we have
assumed for the position of the rotation centre the optical position
given by
Gallouët et
al. (1973):
=
13h13m35.1s,
= 42°17'48",
(1950.0) and a systemic velocity of 500 ± 5 km s-1 which
follows the symmetry of the velocity field in the inner parts about the
optical centre. With the parameters in
Fig. 6 we have calculated a
model HI distribution and velocity field. These are shown in
Fig. 7.
Comparison with Figs. 3 and
4 suggests that we can indeed describe
the major symmetry in the observations with this kind of warp model.
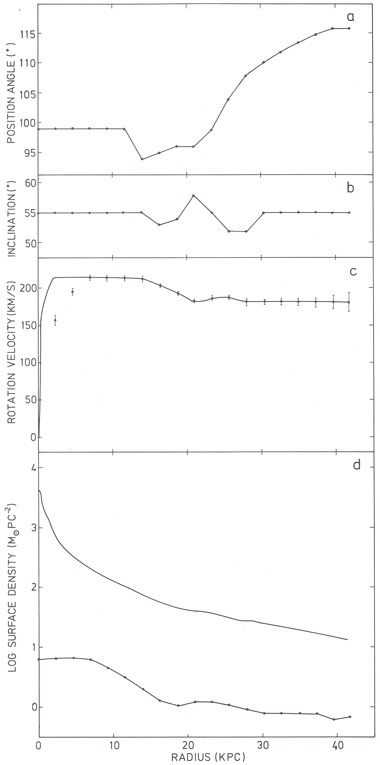 |
Figure 6. Radial variation of position angle of the major axis a, inclination b, rotation velocity c, and surface density of, matter d. The dots in c represent the derived 21 cm rotation velocities, the curve is the input curve for the mass model calculation. The full line in d indicates the surface density of total mass, the dots indicate the surface density of HI gas mass. |
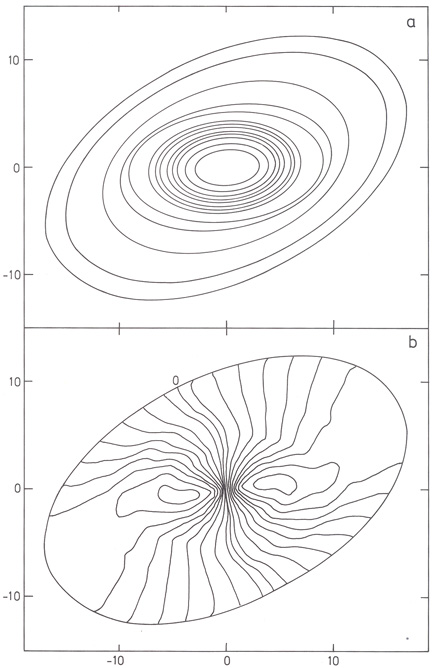 |
Figure 7. Centrally symmetric warp model based on the parameters of Fig. 6. Panel a shows model HI contours: 0, 0.65, 1.3, 1.95, 2.6, 3.25, 3.9, 5.2, 6.5, 7.8, 10.4, 13.0 and again 13.0 times 1020 atoms cm-2. Panel b shows the radial velocity field; the zero contour has been indicated, the other contours are with interval 20 km s-1, starting at -170 km s-1 (thus comparable to Fig. 4). |
A detailed comparison of Fig. 7 with Fig. 3 shows that we cannot reproduce the northern ridge in the HI distribution. At this side of the galaxy the HI drops off abruptly at edge of the ridge and does not extend so far out as it does on the southern side (cf. section 3b and c). Perhaps an additional bend of the outer annuli at the northeastern side results in a configuration where they lie behind each other in the line of sight. This may then be the cause of the ridge, the slightly different behaviour of the radial velocity pattern, and the broader profiles at this side of the galaxy.
There are other asymmetries in NGC 5055, which are more difficult to understand. The light distribution in the outer parts does not align with the changes in the plane of the HI rings. The very faint outer patches seem to lie in the same plane as the bright optical disk. The dust lane, however, especially at the eastern side where it is nearly a straight line, does not seem to lie in any of the annuli of our model. The origin of this dust lane is puzzling. Usually, as in the discussion of the sense of rotation of spirals (De Vaucouleurs, 1958), it is assumed that the outer dust lane lies on the concave side of the spiral arms. Since in NGC 5055 the pitch angle of the arms is about 5° we expect the dust lane to be nearly circular after deprojection, which is apparently not the case. Further note the emission patch 9' SW of the nucleus, which coincides with a HI concentration.
The presence of the asymmetries and the presence of a large amplitude warping in the outer parts of the HI disk of NGC 5055, makes the determination of the mass distribution very difficult. It is not clear at all that the curve of Vc(r) at large radii can be used for a mass model calculation, because the radial velocity observed may contain contributions other than the projected circular velocity. Therefore, if we want to have some estimate of the mass distribution, we have to ignore these complications: we assume that Vc(r), as shown in Fig. 6c, is indeed the "rotation curve".
From this rotation curve we have calculated a mass model with
the thin disk method outlined by
Nordsieck (1973).
We have corrected the
rotation curve in the inner parts for the effect of the poor
spatial resolution of the 21 cm data by replacing it with data from
the optical study of
Van der Kruit and Bosma
(1978).
These data extend to a radius of 50". We have interpolated the points
between 50" and 2.5' using a combination of the data by
Burbidge et al. (1960),
after correction for a zero point error described by Van
der Kruit and Bosma, and our own data. The resulting curve of the
mass surface density,
M(r)
is shown in Fig. 6d. The mass
within a cylinder of radius r, does not converge to a fixed value in
the outer parts, indicating that there is still mass outside the observed
boundary of 41 kpc. The mass out to 41 kpc, Mo, is
2.5 × 10¹¹
M. We
have also made a model fit to the rotation curve with two spheroids'
and a disk using the models described by
Shu et al. (1971).
The total mass in this model, Mt, is
4.2 × 10¹¹
M
about 40% of this mass lies outside 41 kpc.
Although the assumptions used in the construction of the mass
models are incompatible with our contention that NGC 5055 has a
warped disk, we now have a crude estimate of the mass distribution.
We can use this mass distribution to determine the run of M /
L with radius. Comparison with Fish's work
(Fish, 1961)
yields a mass-to-blue
luminosity ratio of 4.75 in the inner 150". The blue magnitude
of NGC 5055 is 8.93
(De Vaucouleurs et al.,
1976),
hence LB = 2.55 × 10¹⁰
L. Thus
we find for MO / LB
a value of 9.8 and Mt / LB = 16.3.
Therefore the mass-to-luminosity ratio increases as function of
radius; in the outer parts it must be of the order of fifty or more.
We are faced with three problems concerning NGC 5055: the warp, the asymmetries, and the increase of the mass-to-light ratio with radius. Hunter and Toomre (1969) have studied the existence of stable, long-lived modes of warping of disks. They did not find such modes in disks with a realistic mass distribution and therefore concluded that a warp has to be pulled by a - rather heavy - companion galaxy during a close passage not too long ago. Such a tidal interaction might then solve the problem of the warp and of the asymmetries at the same time. In Table 1 we have collected data on galaxies that are likely to be close to NGC 5055. The relative distances and velocities between NGC 5055 and the more massive neighbours are so high that the likelihood of a close passage 2 × 10⁹ years ago is very small. (It cannot be excluded, however, that UGC 8313, or one of the other dwarfs close to NGC 5055, has passed nearby and caused some of the asymmetries.) This adds NGC 5055 to the list of galaxies that are warped and have no massive nearby neighbour, which in all likelihood could have caused the warp. Other galaxies in this list are M83 and M33 (Rogstad et al., 1974) and NGC 5907, NGC 4565 and NGC 4244 (Sancisi, 1976).
| Galaxy | Type | BTo | LB(109
L) |
V(km s-1) heliocentric | Distance from NGC 5055 (') |
| NGC 5055 | SA(s)bc II | 8.93 | 25.5 | 500 ± 5 | |
| NGC 5023 | S...c | 12.7† | 0.810 | 393 ± 10 × | 128 |
| DDO 167 | Im V | 16.2† | 0.03 | 163 ± 70 | 260 |
| UGC 8313 | S.. | 14.3† | 0.2 | 630 ± 10 | 25.8 |
| DDO 172 | SB(s)d IV-V | 14.8† | 0.1 | 1216 ± 20 | 31.5 |
| NGC 5194 | SA(s)bc pec | 8.62 | 35.0 | 460 ± 4 | 347 |
| NGC 5195 | Io pec | 10.24 | 7.9 | 552 ± 16 | 352 |
| * All entries, except those derived in this paper, from De Vaucouleurs et al. (1976). | |||||
| † Nilsson's (1973) value corrected with Shostak's (1978) relation. | |||||
| × Fisher and Tully (private comm.) | |||||
In the analysis of Hunter and Toomre (1969) the galaxy has been treated as a disk. Toomre (1977) does not exclude the possibility that stable, long-lived modes of warping may somehow still exist. Perhaps they can be found in another type of mass distribution. One possibility is a halo-disk system. In such a system the restoring forces towards the main plane are not as strong as in a disk system with the same total mass. Therefore it seems likely that in a halo-disk system the time scale for damping of the warp is larger than for a pure disk. If the time scale of the warp can be stretched to about 5 × 10⁹ years or more in this way there is much more chance that a massive companion could have caused it during an encounter. In this way the warp problem would be more or less replaced by the massive halo problem. In this respect it may be noted that the rotation curve of NGC 5055 indicates that there is a substantial amount of mass in the outer region. The spatial distribution of this mass is unknown, but if all the mass is in a disk the stability of this disk is in question.
Of course, there are other ways to solve the problem of the warp of the HI layer. One possibility is that the outermost HI is primordial gas still settling from a cloud that was recently captured by NGC 5055. Both possibilities seem implausible in view of the high degree of central symmetry of the HI layer. Kahn and Woltjer (1959) have suggested that a warp can be produced if a disk galaxy, surrounded by a halo containing cosmic ray particles and relativistic electrons, moves with respect to the intergalactic gas which confines the halo. (The presence of the intergalactic gas was postulated to stabilize small groups of galaxies like the Local Group.) The movement of the galaxy through the intergalactic gas will result in a pressure gradient in the halo. If this pressure is transferred to the disk integral sign shaped galaxies might be formed. The warp of NGC 5055 is a complicated one however. When viewed edge-on the HI layer crosses the main plane twice on both sides of the centre. Therefore this explanation also appears to be unlikely.
From our 21 em line observations of NGC 5055 we conclude:
The extent of the HI distribution is about twice as large as the Holmberg diameter.
The outer ring of HI is probably warped with respect to the plane defined by the bright optical part.
This warp has a complicated structure and seems to rule out an intergalactic wind as a possible cause.
No massive galaxies are found in the immediate neighbourhood of NGC 5055, suggesting that a recent origin of the warp as envisaged by Hunter and Toomre (1969) is unlikely.
A small companion, UGC 8313, at a projected distance of 55 kpc could have caused some of the asymmetries in the outer parts of NGC 5055.
The derived rotation curve of NGC 5055 remains flat in the outer parts. This may imply the presence of a dark halo component in the mass distribution, which could lessen the problem of the maintenance of the warp.
In Table 2 we have collected a number of parameters of NGC 5055 derived in this study.
| Position (1950.0) | =
13h13m35.1s,
= 42°17'48" |
| (Gallouët et al., 1973) | |
| Size (Holmberg, 1958) | 16' × 10.2' |
| Adopted distance | 8 Mpc |
| Luminosity | 2.55 × 10¹⁰
L |
| HI mass | 8.1 × 10⁹
M |
| Total mass, Mo, out to 41 kpc | 2.5 × 10¹¹
M |
| MHI / Mo | 0.032 |
| MHI / LB | 0.32 |
| MO / LB | 9.8 |