


In the foregoing sections we have already touched upon the correlation of a number of physical properties with morphological type. We will now discuss the available information, in particular the question whether there is a one-to-one correspondence between morphological type and one or more physical properties.
We have found that for each galaxy log M(R) is roughly proportional to log R, but galaxies with different rotation velocities, as measured by Vm, have a different constant of proportionality. This indicates that the global mass distribution in spiral galaxies is similar, but galaxies with large Vm are more densely packed than galaxies with small Vm. The difference in Hubble type is not evident from the curves of M(R): for example the Sab galaxy NGC 4151 has about the same M(R) curve as the Sc galaxy NGC 3198. This seems to imply that the Hubble type is mainly determined by differences in the local distribution of matter. It is necessary to assess the influence of Vm first, before discussing Hubble type differences. Note that Vm is loosely correlated with LB and hence connected with Van den Bergh's luminosity class, but that a precise distinction of e.g. luminosity class I, I-II and II in terms of different values for Vm is impossible.
The mass-to-luminosity ratio, both the global one and its radial distribution, does not correlate well with Hubble type. The ratio of the surface densities of total mass and HI gas mass in the outer parts of galaxies correlates better with Vm than with Hubble type. There is, however, a striking difference in these ratios in the inner parts of galaxies of different types. Crudely speaking the ratio of total mass to HI gas mass in the central regions is decreasing towards later types. This is the only clear correlation between morphological type and the physical properties we discussed so far.
Two effects reinforce each other to produce the above correlation: in
early type spirals there is a stronger increase in
 M(R) and
a stronger decrease of
HI(R)
towards the centre than in late type
galaxies. Unfortunately, both these quantities cannot be reliably
determined for most of the galaxies in our sample because of beam
smoothing effects (cf. chapter 3 and
6). Although we have corrected
the 21 cm rotation curves in the inner parts of a number of spirals
with optical data we could not do this correction properly for galaxies
with large nuclear bulges. For the influence of beamsmoothing on
the radial distribution of HI gas we cannot correct at all. This
greatly restrains the discussion of the relation between Hubble type
and the gas-to-mass ratio in the central parts. In about 50% of the
number of galaxies in our sample the resolution in the inner parts is
insufficient.
M(R) and
a stronger decrease of
HI(R)
towards the centre than in late type
galaxies. Unfortunately, both these quantities cannot be reliably
determined for most of the galaxies in our sample because of beam
smoothing effects (cf. chapter 3 and
6). Although we have corrected
the 21 cm rotation curves in the inner parts of a number of spirals
with optical data we could not do this correction properly for galaxies
with large nuclear bulges. For the influence of beamsmoothing on
the radial distribution of HI gas we cannot correct at all. This
greatly restrains the discussion of the relation between Hubble type
and the gas-to-mass ratio in the central parts. In about 50% of the
number of galaxies in our sample the resolution in the inner parts is
insufficient.
We have investigated whether the shape of the curves of
M(R)
show a relation with morphological type. In general these curves have
a peak in the centre and decrease roughly exponentially outward. The
amplitude of the central peak decreases towards later type, as can be
seen in Fig. 3 of
chapter 6. It is difficult to make this statement
more quantitative. We have tried several ways to do this, but none of
them is very satisfactory. The main difficulty is that we have to
find suitable normalization factors, both for the surface density and
the radial coordinate, otherwise we cannot compare galaxies with
different Vm. We have tried to normalize the
M(R)
curves by scaling
them in the radial direction with the radius at which
M = 50
M pc-2.
It turns out that there is still a substantial variety in the slope
of the quasi-exponential part of these scaled curves, thus preventing
a consistent procedure to measure the amplitude of the central peak
above the disk. We can, however, make estimates from the fits we made
to the rotation curves with the spheroids and disk models. In
Fig. 13
we show the percentage of mass in the spheroids as function of Hubble
type and Yerkes form. Only a loose correlation exists. We have listed
other quantities, like the ratio of central surface density to central
disk surface density, again determined from the model fits, in
Table 3.
pc-2.
It turns out that there is still a substantial variety in the slope
of the quasi-exponential part of these scaled curves, thus preventing
a consistent procedure to measure the amplitude of the central peak
above the disk. We can, however, make estimates from the fits we made
to the rotation curves with the spheroids and disk models. In
Fig. 13
we show the percentage of mass in the spheroids as function of Hubble
type and Yerkes form. Only a loose correlation exists. We have listed
other quantities, like the ratio of central surface density to central
disk surface density, again determined from the model fits, in
Table 3.
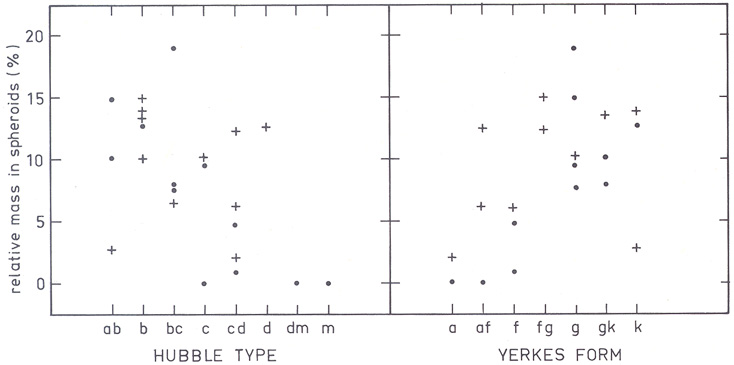 |
Figure 13. Relative mass in the spheroids (Msph / Mfit) vs Hubble type (left) and Yerkes form class (right). Pluses represent galaxies for which the resolution in the inner parts is poor, dots represent galaxies for which the resolution in the centre is adequate or for which a correction has been made with optical data. |
We have also-tried to relate the morphological type to the detailed behaviour of a number of other quantities. Direct comparison of e.g. rotation curves could be done but many of these are somewhat irregular. Moreover, the rotation velocity is not a basic physical quantity but one determined by the distribution of mass and angular momentum. A convenient way to make comparisons for different galaxies is to study the behaviour of dimensionless parameters which can be constructed from the basic physical quantities.
| Galaxy | Hubble type | Yerkes form | relative mass in spheroid % of Mf | log
o
/ do |
log
M
/ HI |
Rmax/Ro |  -curve -curve |
beam correction† |
| N3718 | ||||||||
| M81 | ab | k | 2.9 | 0.67 | > 4 | 0.32 | 3.6 | no |
| N4151 | ab | gk | 10.1 | 1.88 | 3.6 | 0.01 | 15.7 | yes |
| N4736 | ab | g | 14.9 | 1.49 | > 4 | 0.06 | 10.2 | yes |
| M31 | b | k | 12.7 | 1.67 | 3.9 | 0.07 | 10.3 | yes |
| N891 | b | gk | 10.0 | 0.55 | 0.25 | 3.6 | no | |
| N2841 | b | k | 13.9 | 1.41 | > 4 | 0.14 | 8.7 | no |
| N4565 | b | gk | 13.4 | 1.13 | 0.11 | 6.0 | no | |
| N5383 | b | fg | 14.9 | 1.11 | 0.22 | 5.3 | no | |
| N4258 | be | g | 7.7 | 1.16 | 0.10 | 7.4 | ||
| N5055 | be | g | 19.0 | 1.80 | 2.8 | 0.05 | 24.9 | yes |
| M51 | be | f | 6.5 | 0.40 | 2.4 | - | 2.6 | - |
| N7331 | be | gk | 7.8 | 1.18 | 2.7 | 0.13 | 9.3 | yes |
| N253 | ||||||||
| N3198 | c | af | 0 | 0 | 2.2 | 0.35 | 3.5 | |
| N3359 | ||||||||
| N5033 | c | g | 9.4 | 1.47 | 2.9 | 0.06 | 11.7 | yes |
| N5907 | c | g | 10.2 | 0.76 | 0.19 | 5.4 | no | |
| N7640 | ||||||||
| N300 | ||||||||
| M33 | cd | f | 0.89 | 0.49 | 2.1 | 1.0 | 2.6 | |
| I342 | 11.5 | 0.73 | 2.4 | 0.35 | 4.4 | no | ||
| N2403 | cd | af | 6.2 | 0.45 | 1.9 | 1.0 | 3.0 | |
| N4244 | cd | a | 2.1 | 0.17 | 0.58 | 2.9 | no | |
| M83 | cd | fg | 12.2 | 0.62 | 0.26 | - | no | |
| M101 | cd | f | 4.7 | 0.46 | 2.6 | 0.60 | 2.7 | |
| N6946 | ||||||||
| N2805 | ||||||||
| N4631 | d | af | 12.6 | 1.21 | 0.08 | 8.9 | no | |
| N4236 | dm | a | 0 | 0 | 0.90 | 2.1 | ||
| I2574 | ||||||||
| N3109 | 0 | 0 | 0.75 | 2.2 | ||||
| HoII | ||||||||
| N4449 | ||||||||
| Galaxy | 5.7 | 1.32 | 13.6 | |||||
| † if not indicated correction for beamsmoothing is not necessary. | ||||||||
One of these is the parameter
 |
which can be calculated from the curves of the cumulative mass,
M(R), angular momentum, H(R), and kinetic
energy of rotation, E(R).
(R) varies from
0 in the centre to 0.33 ± 0.01 for 22 of the 25
galaxies in our sample. The exceptions are M51 (strange rotation
curve), M33 (the rotation curve we used does not extend beyond a
turnover radius) and M83 (rotation curve comes from one of the
artificial models described by
Hunter and Toomre (1969).
Although we cannot exclude the possibility that the constant value of
(R) is
an artefact of the approximations implicit in the mass model
calculations, the curves of
(R) do
represent a smooth transformation of the
rotation curves. The shape of the
(R) curves is
different for different galaxies: for early type spirals
(R) rises
steeply to about 0.25 and slowly increases over the main disk, and for
late type small galaxies
(R) increases
almost linearly. Late type large galaxies have a curve of
(R)
intermediate between that of early
types and late type small galaxies. In Table 3
we have included a column which gives this information in a quantitative
form: there we present the ratio of radii
 |
A problem with the further interpretation of the
(R)-curves is the
dependence on Ro: if we scale the radial coordinate with
Ro to
achieve a uniform representation we find that e.g. for NGC 2841
r = 3.8 if Ro = 7' and
r = 8.7 if Ro = 14'.
This dependence of possible type indicators on Ro is also
present in the other quantities listed in
Table 3. For instance,
in the mass model fits the Toomre disk is fitted first, and for
the nearly flat rotation curves the turnover-radius associated
with this disk had to be taken close to Ro in order to
achieve a
good fit. It is therefore difficult to find a good criterion for
making an ordering of the galaxies in terms of a dynamical sequence.
Nevertheless, there are weak indications that there is not a unique
correspondence of Hubble type or Yerkes form with the dynamical
type indicators we have investigated. From Table 3
we can see that if we use central mass concentration
(logo /
do where
o is the
central surface density and
do
the central surface density of the Toomre disk) as a criterion to form a
dynamical sequence we have in order of
logo /
do :
NGC 4151 (Sab, gk),
NGC 5055 (Sbc, g), M31 (Sb, k), NGC 4736 (Sab, g), NGC 5033 (Sc, g), NGC 2841 (Sb, k),
NGC 4631 (Sd, af), NGC 7331 (Sbc, gk), NGC 4258 (Sbc, g) and so on.
This list contains 5 Hubble stages and 4 Yerkes form classes and
these occur not in their proper sequence. We get more or less the
same list if we use the shape of the
(R)-curve, or
even the quantity Rmax / Ro, where
Rmax is the radius where the
rotation curve becomes roughly flat, as the ordering criterion.
From the above discussion we conclude for the moment that the
morphological stages do not have a one-to-one correspondence with
the physical quantities we can derive from 21 cm line data. Only
the loose correlations, found already in studies of the integral
properties, are found back. In that respect we must emphasize that
correlations derived from integral properties cannot be interpreted
in a straightforward way. For this it is necessary to assume an
"ideal form" of the radial distribution of matter. An interesting
result like the correlation between the shape of the integral HI
profile and Hubble type
(Shostak, 1977)
is not easy to translate
into a statement about the shapes of rotation curves and the forms
of the distribution of
HI in
galaxies of different morphological
types. This can be illustrated by considering Shostak's data for
those galaxies for which a Yerkes form class is available. The
shape of integral HI profiles is usually characterized by two peaks
at either side of the systemic velocity. The peak-to-centre ratio,
p, can be estimated by averaging the amplitude of the two peaks and
dividing it by the amplitude at the systemic velocity (see
Shostak, 1977
for details). In Fig. 14 we show p as function
of Yerkes form
for different Hubble types. p is apparently better correlated with
Hubble type (cf. Shostak's Fig. 1, and the separation of symbols in
Fig. 14) than with Yerkes form, despite the
good correlation between 4
these two classification systems. This result illustrates also that
no simple one-to-one correspondence exists between the morphological
types and physical quantities derived from 21 cm line data.
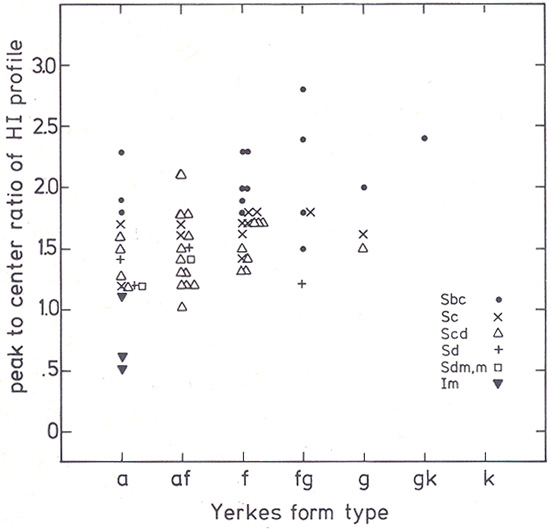 |
Figure 14. Peak-to-centre ratio of the HI profile vs. Yerkes form for the galaxies in the sample of Shostak (1977). The various symbols represent different Hubble types. |
To conclude, we find that probably only loose correlations can be found between morphological class and the radial distributions of total mass and HI gas mass. The luminosity classes are loosely correlated with the mean rotation velocity Vm. The Hubble type and Yerkes form are loosely correlated with the amount of matter in the central regions in excess to that in the disk. There is a large variety among galaxies of the same morphological subclass and occasionally a great similarity between galaxies of different morphological types. This must be due to differences in the individual history of each spiral galaxy.