


Extragalactic deep surveys with ISO were performed in the mid and far
IR with ISOCAM
(Cesarsky et al.
1996)
and ISOPHOT
(Lemke et al. 1996)
respectively. In both wavelength ranges, the steep slopes of the
number counts indicate that a rapid decline of the IR emission of
galaxies must have taken place from around z ~ 1 to z
= 0. As shown in Fig. 1, ISOCAM could detect
galaxies at 15 µm in the
LIRG regime up to z ~ 1.3, while ISOPHOT was limited to either
nearby galaxies or moderately distant ULIRGs such as the one of
LIR ~ 4 × 10¹²
L at a redshift
of z = 1 shown in the
Fig. 1 (normalized SED of Arp 220). The detection limits
of ISOCAM and ISOPHOT are compared to SCUBA and Spitzer in the
Fig. 2. The deepest ISO surveys reached a
completeness limit of 0.1 mJy at 15 µm (plain line) and a
depth of S15 ~ 40µJy (incomplete,
Aussel et al. 1999)
in blank fields or a twice deeper completeness level in the central part
of nearby galaxy clusters using lensing magnification
(Altieri et al. 1999,
Metcalfe et al.
2003),
and 120 mJy at 170 µm (dotted line). The right axis on
the plot shows the conversion of the IR detection limit into a SFR
detection limit. Any galaxy forming stars at a rate larger than 30
M
yr-1 could be detected with ISOCAM up to z ~ 1, assuming
that the measured 15 µm flux density of a galaxy can be used to
derive its "bolometric" IR luminosity, i.e. LIR =
L(8-1000 µm ) (see Sect. 5.2).
at a redshift
of z = 1 shown in the
Fig. 1 (normalized SED of Arp 220). The detection limits
of ISOCAM and ISOPHOT are compared to SCUBA and Spitzer in the
Fig. 2. The deepest ISO surveys reached a
completeness limit of 0.1 mJy at 15 µm (plain line) and a
depth of S15 ~ 40µJy (incomplete,
Aussel et al. 1999)
in blank fields or a twice deeper completeness level in the central part
of nearby galaxy clusters using lensing magnification
(Altieri et al. 1999,
Metcalfe et al.
2003),
and 120 mJy at 170 µm (dotted line). The right axis on
the plot shows the conversion of the IR detection limit into a SFR
detection limit. Any galaxy forming stars at a rate larger than 30
M
yr-1 could be detected with ISOCAM up to z ~ 1, assuming
that the measured 15 µm flux density of a galaxy can be used to
derive its "bolometric" IR luminosity, i.e. LIR =
L(8-1000 µm ) (see Sect. 5.2).
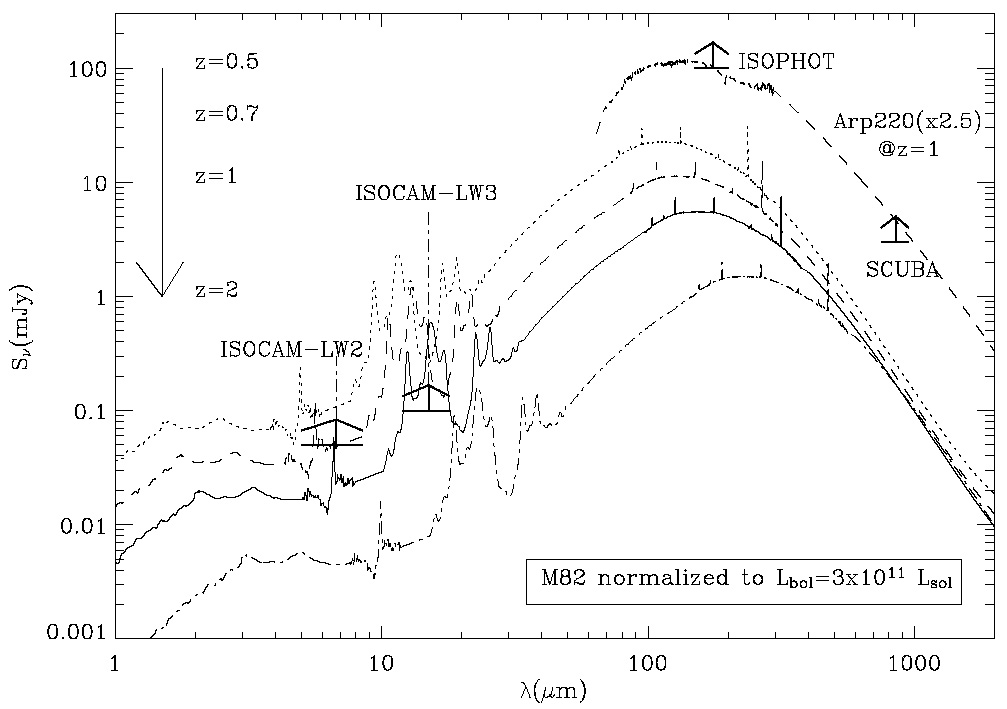 |
Figure 1. Effect of the k-correction on the
detection of distant LIRGs
and ULIRGs by ISOCAM, ISOPHOT and SCUBA. Only ISOCAM at
15 µm can detect LIRGs up to z ~ 1, while ISOPHOT and
SCUBA are sensitive to distant ULIRGs of a few 1012
L |
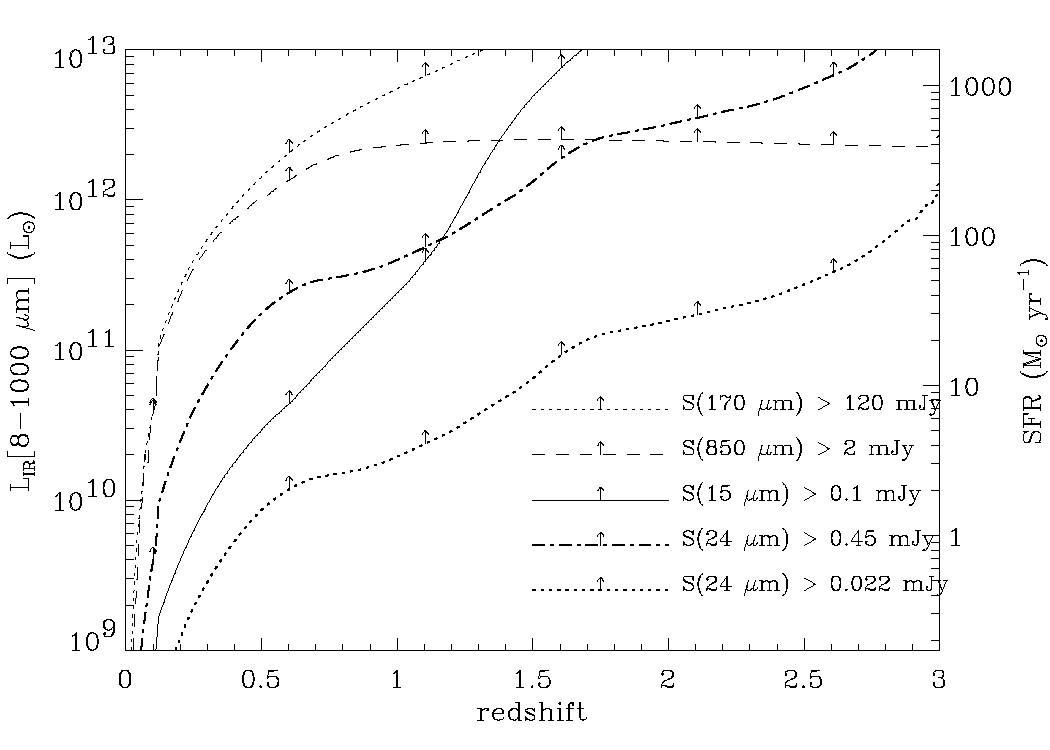 |
Figure 2. Sensitivity limits of ISOCAM (15 µm , 0.1 mJy), ISOPHOT (170 µm , 120 mJy), SCUBA (850 µm , 2mJy) and Spitzer (24 µm , 0.45 mJy and 0.022 mJy corresponding to the expected detection limits of the SWIRE and GOODS Legacy Programs). This figure was generated assuming that distant galaxies SEDs are similar to local ones. We used the library of template SEDs constructed by Chary & Elbaz (2001). |
Number counts represent the first scientific result of an extragalactic survey. They can be used to constrain the models. Used alone, they leave some degeneracies unsolved but at least they can demonstrate whether the distant universe was different from the local one in this wavelength range by comparing them to "no evolution" predictions assuming some spectral energy distributions (SEDs) for the k-correction.