


Deep images of blank fields at 6.75 and 15 µm done with ISOCAM provide a different view on the distant universe. While the ISOCAM-LW3 filter, centered at 15 µm , can probe dust emission up to z ~ 2 for luminous objects, the redshift range to probe star formation from dust emission with the ISOCAM-LW2 band, centered at 6.75 µm , is limited to the relatively nearby universe due to k-correction. However the emission of the old stellar component, which peaks in the near IR, being brought to this wavelength range for high-z galaxies, their stellar masses are better constrained from this flux density.
Sato et al. (2004)
derived stellar masses around M* ~
1011 M for galaxies with z ~ 0.2-3 from the
correlation between rest-frame near IR luminosity and stellar mass.
The stellar mass-to-light ratios were derived from model fit of the
set of observed magnitudes depending on the galaxies star formation
histories.
for galaxies with z ~ 0.2-3 from the
correlation between rest-frame near IR luminosity and stellar mass.
The stellar mass-to-light ratios were derived from model fit of the
set of observed magnitudes depending on the galaxies star formation
histories.
The contribution of the 6.75 µm selected galaxies to the cosmic stellar mass density of galaxies per unit comoving volume as a function of redshift were estimated to be comparable to those inferred from observations of UV bright galaxies (see Fig. 3). Given the narrow mass ranges, these estimates were obtained as simple summations of the detected sources and should therefore be considered as lower limits only. The faint 6.7 µm galaxies generally had red colors. A comparison with a particular population synthesis model suggests that they have experienced vigorous star formation at high redshifts. The derived large stellar masses for the faint 6.7 µm galaxies also support such star forming events at the past. However these events can only be detected at longer wavelengths using the 15 µm ISOCAM or 90 and 170 µm ISOPHOT bands with ISO (or SCUBA at 850 µm and now the Spitzer Space Telescope). The next sections are devoted to these surveys and their consequences on our understanding of the history of star formation in the universe.
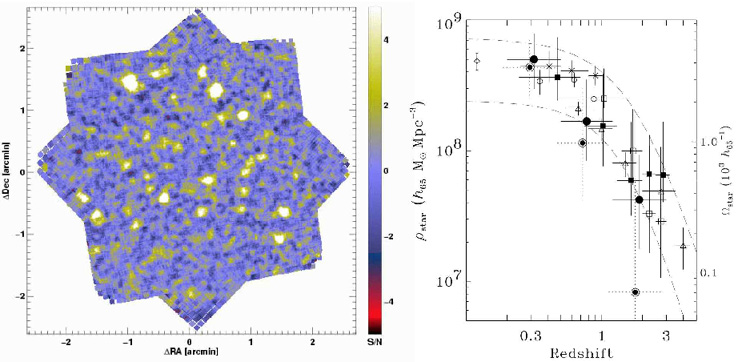 |
Figure 3. (left) ISOCAM
6.75 µm image of the SSA13 field (Fig. 2 from
Sato et al. 2003,
23 hour observation). This image reaches an
80% completeness limit of 16µJy in the central 7
arcmin2 region. North is top and east to the left in
J2000. The center is (RA, Dec) = (13h 12m
26s, 42° 44' 24".8). The map shows signal-to-noise
ratio
(S/N) per 0.6 arcsec sub-pixel. The signal is an average, weighted by
the inverse of the assigned variance, and the noise is a normalized
standard deviation. (right) Stellar mass density in the universe
as a function of redshift (Fig. 13 from
Sato et al. 2004).
The right axis shows densities normalized to the critical density of the
universe. The contributions of the 6.75 µm galaxies are shown
with solid and double circles for the "combined" (including
photometric redshifts) and purely spectroscopic samples, respectively.
The double circles are plotted at slightly lower redshifts. The
horizontal bars represent the redshift ranges of the bins and the
vertical bars show one sigma errors, taking account of Poisson noise
and uncertainties in stellar mass and Vmax. Several other
estimates are overlaid (see
Sato et al. 2004
for references). The
empty/solid squares and the diamond are obtained from full integration
of a Schechter fit to their respective luminosity or stellar mass
function at each redshift bin. The X marks and the empty circles are
quasi-fully integrated values with a finite integration range from
10L* to 1/20 L*,
and 10.5 <
log(Mstar[h65-2
M |