Copyright © 2000 by Annual Reviews. All rights reserved
| Annu. Rev. Astron. Astrophys. 2000. 38:
667-715 Copyright © 2000 by Annual Reviews. All rights reserved |


5.5. Global star-formation history and chemical evolution
Interest in the integrated background light from galaxy formation is long-standing (e.g. [Bondi et al. 1955]), and has motivated a large number of experiments aimed at measuring the diffuse extragalactic background (e.g. [Spinrad & Stone 1978, Dube et al. 1979, Matsumoto et al. 1988, Bernstein 1997, Hauser et al. 1998]). Although the integrated background records the light from all galaxies, whether or not they are individually detected, the task of separating out galactic foregrounds and instrumental backgrounds is formidable, and many of the measurements are only upper limits. An alternative approach is to add up the UV emission from galaxies that are individually detected. This approach formally produces only a lower limit for the true UV luminosity density, but it provides a basis for exploring connections of the high- and low-redshift universe and for deciding which of the various selection effects are plausible and important.
The UV emission from galaxies is directly connected to their metal
production
[Cowie et al. 1988]
because the UV photons come from the same
massive stars that produce most of the metals through type II SNe. The
relation between UV emissivity and metal production is not strongly
dependent on the initial mass function, varying by a factor of only 3.3
between the
[Salpeter
1955] and
[Scalo 1986]
forms. In
contrast, the relation of UV emission to the total star-formation rate
is much more tenuous because the low-mass end of the IMF contains most
of the mass whereas the high-mass end produces most of the UV emission.
As a result, it is easier to constrain the history of metal production
in the universe than it is to constrain the overall star-formation
history. Prior to the HDF, estimates of the metal-production vs. redshift,
 Z(z) had been
made from ground-based galaxy redshift surveys
[Lilly et
al. 1996]
and from QSO absorption line statistics (e.g.
[Lanzetta et
al. 1995,
Pei & Fall 1995,
Fall et al. 1996]),
and the observations at the time
suggested an order-of-magnitude increase in
Z(z) from z = 0 to z = 1.
Z(z) had been
made from ground-based galaxy redshift surveys
[Lilly et
al. 1996]
and from QSO absorption line statistics (e.g.
[Lanzetta et
al. 1995,
Pei & Fall 1995,
Fall et al. 1996]),
and the observations at the time
suggested an order-of-magnitude increase in
Z(z) from z = 0 to z = 1.
[Madau et
al. 1996]
made the first attempt to connect the luminosity density
in HDF high-redshift galaxy samples to lower-redshift surveys.
The plot of the metal-formation rate vs. redshift
has provided a focal point for discussion
of the HDF and for comparisons to theoretical models.
In the [Madau et
al. 1996]
paper, galaxies in redshift slices
2 < z < 3.5 and 3.5 < z < 4.5 were identified
by strict color-selection criteria that were shown via simulations
to provide strong rejection of objects outside of the desired
redshift intervals. The luminosity of the galaxies within these
redshift intervals was estimated by simply summing the observed fluxes
of the galaxies, and no dust or surface-brightness corrections were
applied. The results were presented as lower limits because nearly all
of the corrections will drive the derived metal-formation rates
up. The initial
[Madau et
al. 1996]
diagram showed a metal-production
rate at z ~ 4 that was roughly a factor of 10 lower than the rate
at z ~ 1.
[Madau 1997]
subsequently modified the
color-selection criteria and integrated down an assumed luminosity
function, revising the z > 2 rates upward by about a factor of 3.
There was remarkable agreement between
Z(z) derived
from the galaxy luminosities, the results
of [Pei & Fall
1995],
and the predictions of hierarchical models (e.g.
[White & Frenk
1991,
Cole et al. 1994,
Baugh et al. 1998]),
all of which show a peak in the metal production rate at z ~ 1 - 2.
Subsequent work in this area has focused on (a) galaxy
selection (b) effects of dust, and (c) the connection of
the Madau diagram to general issues of galaxy evolution and
cosmic chemical evolution, which we discuss in turn.
The color-selection criteria of [Madau et al. 1996] are extremely conservative, and spectroscopic surveys [Steidel et al. 1996, Lowenthal et al. 1997] have identified at least a dozen 2 < z < 3.5 galaxies with U300 - B450 > 1.3 but with B450 - I814 redder than the [Madau et al. 1996] selection boundary. Alternative color-selection criteria (particularly in the 2 < z < 3.5 range) have been explored in a number of studies [Clements & Couch1996, Lowenthal et al. 1997, Madau et al. 1998, Meurer et al. 1999], with the result that the luminosity-density goes up as the area in color space is enlarged. The number of low- z interlopers also may go up, although spectroscopic surveys suggest that the [Meurer et al. 1999] selection boundary is not prone to this problem. Similar techniques have been applied to ground-based images covering much wider areas but sensitive only to brighter objects (see, e.g. [Steidel et al. 1999] and [Giallongo et al. 1998] for recent examples). Substantial progress has been made both in refining the estimates of the volume sampled by the color selection and in estimates of the high- z galaxy luminosity functions [Dickinson 1998, Steidel et al. 1999]. These allow more precise (but more model-dependent) estimates of the luminosity density at z > 3. In Fig. 5 we provide an updated plot of star-formation vs. redshift from the color-selected samples of [Steidel et al. 1999] and [Casertano et al. 2000], now including integration down the luminosity function and a correction for mean dust attenuation.
 |
Figure 5. (Left) Star-formation rate
density vs. redshift derived from ultraviolet luminosity density. The
z > 2
points are from Lyman-break objects in the Hubble deep field (HDF) north
(open triangles), in the HDF-south
(filled triangles) and in the Steidel et al. (1999) ground-based
survey (X's). The luminosity density has been
determined by integrating over the luminosity function and
correcting for extinction following the prescription of
Steidel et al. (1999).
Distances and volumes are computed using the cosmological parameters
h,
|
Photometric redshifts computed via template fitting can also be used
to identify samples of high-z objects, and
several such samples have been presented and discussed
[Lanzetta et
al. 1996,
Sawicki et al. 1997,
Sawicki & Yee
1998,
Miralles & Pello
1998,
Rowan-Robinson 1999,
Fontana et
al. 1999].
Luminosity densities at z > 2 from these studies are generally
higher than those of
[Madau et
al. 1996],
and the apparent drop in
Z(z) at
z  2 is not
universally
evident. A striking example of the difference between color-selected
samples and photometric-redshift selected samples is the fact
that HDF-S comes out with a higher UV luminosity-density
than HDF-N in the color-selected sample shown in
Fig. 5,
but a lower luminosity density in the photometric-redshift selected
sample of
[Fontana et
al. 1999].
One general concern about object selection is that galaxies
at lower redshift are typically brighter than the high-z
objects. Interlopers that make it into photometric samples
can dominate the UV luminosity-density estimates.
2 is not
universally
evident. A striking example of the difference between color-selected
samples and photometric-redshift selected samples is the fact
that HDF-S comes out with a higher UV luminosity-density
than HDF-N in the color-selected sample shown in
Fig. 5,
but a lower luminosity density in the photometric-redshift selected
sample of
[Fontana et
al. 1999].
One general concern about object selection is that galaxies
at lower redshift are typically brighter than the high-z
objects. Interlopers that make it into photometric samples
can dominate the UV luminosity-density estimates.
It does appear evident that the original criteria of
[Madau et
al. 1996]
were too
conservative, and the directly measured UV luminosity density
in bins at z ~ 3 and z ~ 4 is not demonstrably lower
than it is at z ~ 1.
At still higher redshifts, from the very small number
of candidate objects with z > 5,
[Lanzetta et
al. 1998]
computes an upper limit on the star-formation density at
z ~ 5 - 12. For the cosmology adopted here, the limit on star
formation in galaxies with
 100h
M
100h
M yr-2 is
lower than the inferred rate from Lyman-break galaxies at z = 4.
With NICMOS observations it has become possible to identify
z > 5 candidates to much fainter limits, detecting objects
with UV luminosities more like those of typical Lyman break
galaxies at 2 < z < 5.
[Dickinson
2000]
derives number counts for color-selected candidates at
4.5 < z < 8.5 in the
HDF-N/NICMOS survey, and finds that they fall well below
non-evolving predictions based on the well-characterized z = 3
Lyman break luminosity function. It appears that the space
density, the luminosities, or the surface brightnesses (and hence,
the detectability) of UV bright galaxies fall off at z > 5,
at least in the HDF-N.
yr-2 is
lower than the inferred rate from Lyman-break galaxies at z = 4.
With NICMOS observations it has become possible to identify
z > 5 candidates to much fainter limits, detecting objects
with UV luminosities more like those of typical Lyman break
galaxies at 2 < z < 5.
[Dickinson
2000]
derives number counts for color-selected candidates at
4.5 < z < 8.5 in the
HDF-N/NICMOS survey, and finds that they fall well below
non-evolving predictions based on the well-characterized z = 3
Lyman break luminosity function. It appears that the space
density, the luminosities, or the surface brightnesses (and hence,
the detectability) of UV bright galaxies fall off at z > 5,
at least in the HDF-N.
5.5.2. Dust and selection effects
Many of the discussions of the Madau diagram have centered around
selection effects and whether the data actually support a decrease in
Z(z) for
z
2. Star-formation in dusty or
low-surface-brightness galaxies may be unaccounted
for in the HDF source counts. Meurer and collaborators
[Meurer et
al. 1997,
Meurer et al. 1999]
use local starburst galaxy samples to calibrate a
relation between UV spectral slope and far-IR (60 - 100 µm)
emission, and hence compute bolometric corrections for dust
attenuation. They apply these corrections to a sample of
color-selected Lyman-break galaxies in the HDF and derive an
absorption-corrected luminosity density at z ~ 3
that is a factor of 9 higher than that derived by
[Madau et
al. 1996].
Not all of this comes from the dust
correction; the luminosity-weighted mean dust-absorption factor for the
[Meurer et al. 1999]
sample is 5.4 at 1600Å.
[Sawicki & Yee
1998]
analyzed the optical/near-IR spectral energy distributions of
spectroscopically
confirmed Lyman-break galaxies in the HDF and found the best fit
synthetic spectra involved corrections of more than a factor of 10.
Smaller corrections were derived by
[Steidel et
al. 1999]
for a sample of galaxies of similar luminosity.
In general, the danger of interpreting UV spectral slopes as a
measure of extinction is that the inferred luminosity corrections are
very sensitive to the form of the reddening law at UV wavelengths. For the
[Calzetti et
al. 1994]
effective attenuation law, used in
all of the aforementioned studies, a small change in the UV color
requires a large change in the total extinction. Photometric errors
also tend to increase the dust correction, because objects that scatter
to the red are assigned larger corrections that are not offset by
smaller corrections for the blue objects. The corrections for dust
must thus be regarded as tentative, and must be confirmed with more
extensive H studies such
as that of
[Pettini et
al. 1998],
and further studies in the mid-IR, radio, and sub-millimeter.
studies such
as that of
[Pettini et
al. 1998],
and further studies in the mid-IR, radio, and sub-millimeter.
The NICMOS HDF observations provide some additional insight into
possible reddening corrections. Figure 6 shows the
spectral-energy distributions of HDF galaxies with spectroscopic
2.5 < z < 3.5, superimposed on models with a
constant star-formation rate and an age of 109 years.
The galaxies are typically best fitted with ages 107-9 years
and reddening 0.1 < E(B - V) < 0.4 with the
[Calzetti et
al. 1994]
attenuation law.
Very young galaxies with little extinction appear to be rare, and
older or more reddened galaxies would possibly escape the Lyman-break
selection. However,
[Ferguson
1999]
identified only 12 galaxies with
V606 < 27 in the HDF-N that fail the
[Dickinson
1998]
color criteria but nevertheless have
2.5 < zphot < 3.5 from spectral-template fitting.
In general these galaxies fall just outside the color
selection boundaries, and the non-dropout sample contributes only 12% of
the luminosity-density of the dropout sample.
It thus appears unlikely that there is a population that
dominates the metal-enrichment rate at z ~ 3 that is just
missing from the Lyman-break samples. If the optically unidentified
sub-millimeter sources (see Section 4.7)
are really at
z 3,
they are probably a disjoint population, rather than simply the red tail
of the Lyman-break population.
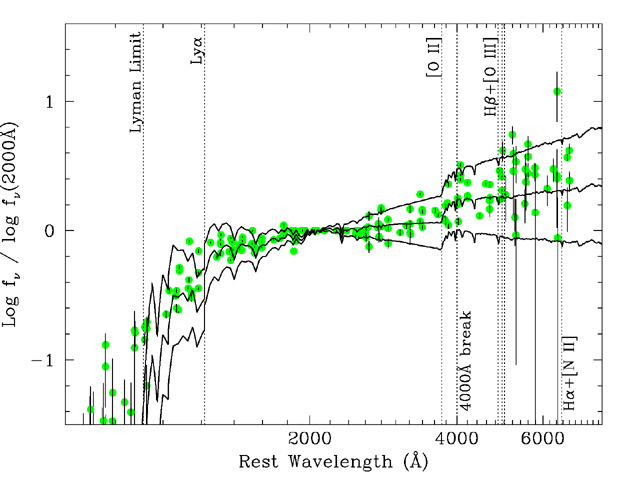 |
Figure 6. Spectral energy distributions of 28 spectroscopically confirmed Lyman-break galaxies with 2.5 < z < 3.5, superimposed on stellar population models. The models assume solar metallicity and a Salpeter IMF and include attenuation due to the IGM for z = 3. The models reflect constant star formation for 109, with different amounts of interstellar dust attenuation. The reddening values are E(B - V) = 0, 0.2, and 0.4, with the curve that is highest at long wavelengths having the highest value. The Calzetti et al. (1994) attenuation law was used. |
If sources akin to ultra-luminous IRAS galaxies were present at z ~ 3 in the HDF, it is likely that they would be detected, but unlikely that they would be identified as Lyman-break galaxies. [Trentham et al. 1999] use HST observations to extend the spectral energy distributions for three nearby ultra-luminous IR galaxies down to rest-frame 1400 Å. Although this is not far enough into the UV to predict HDF B450 colors at z = 3 with confidence, it at least gives some indication of whether such galaxies are detectable. All three galaxies would likely be detected in the F814W band if shifted out to z = 3, although VII Zw 031 would be very near the detection limit. None of the galaxies would meet the [Madau et al. 1996] Lyman-break galaxy selection criteria, but might plausibly show up as high-z objects from their photometric redshifts.
In addition to dust, cosmological surface-brightness can bias the
samples of high-redshift galaxies.
For fixed luminosity and physical size, i.e. no evolution,
surface-brightness will drop by about 1 mag between z = 3 and
z = 4. This lower surface brightness will result in a decrease in the
number density of objects and the inferred luminosity density, even if
there is no intrinsic evolution. Using simulated images for one
particular galaxy evolution model
[Ferguson & Babul
1998],
[Ferguson
1998b]
arrived at corrections to
Z(z) of a factor of 1.5 at z ~ 3
and 4.7 at z ~ 4.
[Lanzetta et
al. 1999]
have looked at
surface-brightness selection in a less model-dependent way, computing
the star-formation "intensity" (in
solar masses per year per square kiloparsec)
from the UV flux in each pixel of the galaxy images. The comoving volume
density of the regions of highest star-formation intensity appears to
increase monotonically with increasing redshift, whereas a strong
selection cutoff for star-formation intensities less than 1.5
M
yr-1 kpc-2 affects samples beyond z >
2. The results suggest that surface-brightness effects produce a
substantial underestimate of
Z(z) at high redshift.
The undetected low-surface-brightness UV-emitting regions should contribute to the total diffuse background in the image. [Bernstein 1997] has attempted to measure the mean level of the extragalactic background light (EBL) in the HDF images, while [Vogeley 1997] has analyzed the autocorrelation function of the residual fluctuations after masking the galaxies. [Vogeley 1997] concludes that diffuse light clustered similarly to faint galaxies can contribute no more than ~ 20 % of the mean EBL. In contrast [Bernstein 1997], concludes that the total optical EBL is two to three times the integrated flux in published galaxy counts. The two results can be made marginally compatible if the fluxes of detected galaxies are corrected for light lost outside the photometric apertures and for oversubtraction of background due to the overlapping wings of galaxy profiles. If this interpretation is correct, there is not much room for the UV luminosity density to increase significantly at high redshift.
5.5.3. Connection to galaxy evolution
An important use of the metal-enrichment rate derived from the HDF and
other surveys is the attempt to "close the loop": to show that the
emission history of the universe produces the metal abundances and
stellar population colors we see at z ~ 0.
[Madau et
al. 1996]
made a first attempt at this, concluding that the metals we observe being
formed [integrating
Z(z) over time] are a substantial
fraction of the entire metal content of galaxies.
[Madau et al. 1998]
compared the integrated color of galaxy populations
in the local universe to that expected from the UV-emission history,
exploring a variety of options for IMF and dust obscuration. With a
Salpeter IMF and modest amounts of dust attenuation, they find that a
star-formation history that rises by about an order of magnitude from
z = 0 to a peak at
z ~ 1.5 is compatible with the present-day
colors of galaxies, with the FIR background, and with the metallicities
of damped Ly absorbers.
[Fall et al. 1996],
[Calzetti &
Heckman 1999] and
[Pei et al. 1999]
have attempted to incorporate dust and
chemical evolution in a more self-consistent way. The models include
a substantial amount of obscured star-formation; more than 50% of the
UV radiation is reprocessed by dust.
The obscuration corrections increase the value of
Z(z) from samples
already detected in optical surveys, but do not introduce whole
classes of completely dust-obscured objects. Although there are significant
differences in the inputs and assumptions of the models, in all
cases a model with a peak in
Z(z) at z ~ 1 - 1.5 is found
consistent with a wide variety of observations. In particular the
models can simultaneously fit the COBE DMR and FIRAS measurements of the
cosmic IR background
[Puget et
al. 1996,
Hauser et
al. 1998,
Fixsen et
al. 1998]
and the integrated light from galaxy counts. The total mass in metals
at z = 0 is higher in these new models than in those of
[Madau et
al. 1996],
but the local census now includes metals in cluster X-ray gas, which
were ignored by
[Madau et
al. 1996].
Overall, the success of these consistency checks is quite remarkable. Various imagined populations of galaxies (dwarfs, low-surface-brightness galaxies, highly dust obscured objects, etc.) now seem unlikely to be cosmologically dominant. The fact that the UV emission, gas metallicities, and IR backgrounds all appear capable of producing a universe like the one we see today leaves little room for huge repositories of gas and stars missing from either our census at z = 0 or our census at high redshift.
Nonetheless, there is room for caution in this conclusion. In clusters
of galaxies, the mass of metals ejected from galaxies into the X-ray
emitting gas exceeds that locked inside stars by a factor of 2-5
[Mushotzky &
Loewenstein 1997].
If the same factor applies to galaxies outside clusters
[Renzini 1997],
then the local mass-density of metals
greatly exceeds the integral of metal-enrichment rate, implying that
most star-formation is hidden from the UV census (although the
differences in galaxy morphology in clusters and the field suggests
that clusters might not be typical regions of the universe). Various
lines of evidence cited in
Section 5.3 point to old ages
for elliptical galaxies (both inside and outside of clusters) and the
bulges of luminous early-type spirals
[Renzini 1999,
Goudfrooij et
al. 1999].
The requirements for the early formation of metals in these systems
look to be at odds with the inferences from the models described above.
[Renzini 1999]
estimates that 30% of the current density of metals
must be formed by z ~ 3, whereas the best-fit models to the
evolution of the luminosity density have only 10% formed by then. The
discrepancy is interesting but is not outside of the range of error of
the estimates of both
Z(z) and the ages of stellar populations
in present-day spheroidal systems.
It also remains a challenge to ascertain how the metals
got from where they are at high redshift to where they are today. The
bulk of the metals locked up in stars at z = 0 are in luminous,
normal, elliptical and spiral galaxies. If elliptical galaxies (and
spheroids in general) formed early and rapidly, they probably account
for the lion's share of
Z(z) above z = 2. Thus the metals
formed in the z = 1 peak of
Z(z) must end up for the most part in
luminous spiral galaxies today. This is difficult to reconcile with
the lack of evolution observed in number-density or luminosity
of luminous spirals out to z = 1. An order-of-magnitude decline
in star-formation rate in galaxy disks since z = 1 also seems
inconsistent with present-day colors of spiral galaxy disks, or with
star-formation histories derived from chemical-evolution models (e.g.
[Tosi 1996,
Prantzos & Silk 1998]).
Furthermore, at z ~ 1 it
appears that compact-narrow-emission-line galaxies
[Guzman et
al. 1997]
and irregular galaxies account for a significant
fraction of the UV luminosity density. If these galaxies fade
into obscurity today, then they have not been accounted for in the
census of metals in the local universe, and the z = 0 metallicity
should be revised upwards in the global chemical-evolution models.
On the other hand if these galaxies are merging into luminous spirals
and ellipticals, it is hard to understand how luminous spiral and
elliptical galaxy properties can remain consistent with PLE models out
z = 1.
 m,
m,
 ,
,