


2.5. Petrosian index and magnitude
The Petrosian (1976,
his Equation 7) function
 (R)
is given as
(R)
is given as
| (26)
|
It is the average intensity within some projected radius R divided by the intensity at that radius. The logarithmic expression is written as

| (28) |
and is shown in Figure (6) for a range of profile shapes n.
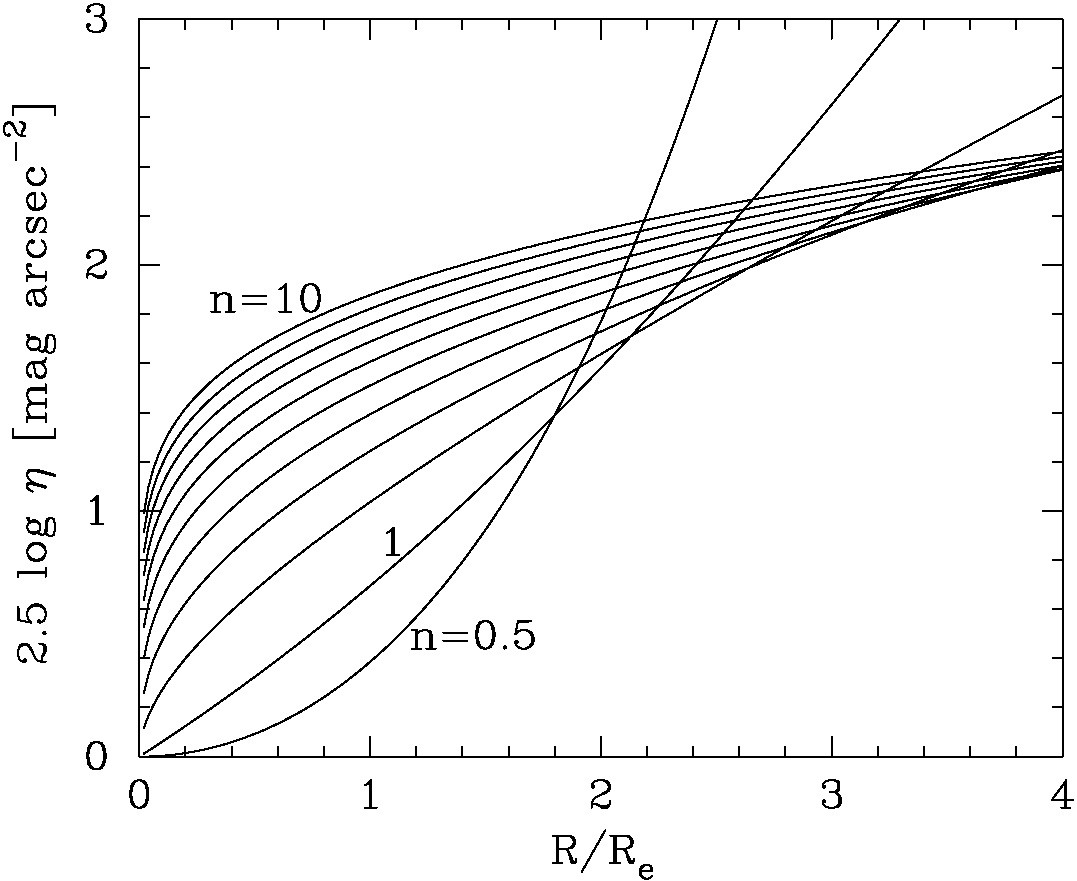 |
Figure 6. The logarithm of the Petrosian
function
|
This is a particular clever quantity because if every galaxy had the
same stellar distribution, such as an R1/4 profile,
then a radius where the
-function
equalled some pre-defined, constant value
would correspond to the same number of Re for every
galaxy. Moreover, such measurements are unaffected by such things as
exposure-depth, galactic dust, and cosmological redshift dimming
because they affect both surface brightness terms in Equation (28)
equally. Even though it is possible to measure the Petrosian radius
without ever assuming or specifying an underlying light-profile
model, the actual form of the stellar distribution is implicitly
incorporated into the Petrosian function and so cannot be ignored
(as Figure 6 reveals).
It turns out the Petrosian function is equal to
| (29) |
where  (R) is
given in Equation (24;
Djorgovski & Spinrad
1981;
Djorgovski, Spinrad &
Marr 1984;
Sandage & Perelmuter
1990,
their Section IIa;
Kjærgaard, Jorgensen,
& Moles 1993).
Thus
(R) is
given in Equation (24;
Djorgovski & Spinrad
1981;
Djorgovski, Spinrad &
Marr 1984;
Sandage & Perelmuter
1990,
their Section IIa;
Kjærgaard, Jorgensen,
& Moles 1993).
Thus
| (30) |
The flux within twice the radius RP when
1 / (RP) = 0.2 is often used to estimate an
object's flux (e.g.,
Bershady, Jangren, &
Conselice 2000;
Blanton et al. 2001),
as is the flux within 3RP when
1 / (RP) = 0.5 (e.g.,
Conselice, Gallagher, & Wyse 2002;
Conselice et al. 2003).
How well this works
of course depends on the shape of the light-profile, and
Figure (7) shows these approximations to the total
luminosity as a function of the Sérsic index n. In the case of
2RP when
1 / (RP) = 0.2, one can see that profiles
with n = 10 will have their luminosities under-estimated by 44.7% and
those with n = 4 by only 17.1%. The situation is considerably worse
when using 3RP and
1 / (RP) = 0.5. A prescription
to correct for the missing light, beyond one's chosen aperture,
is detailed in
Graham et al. (2005).
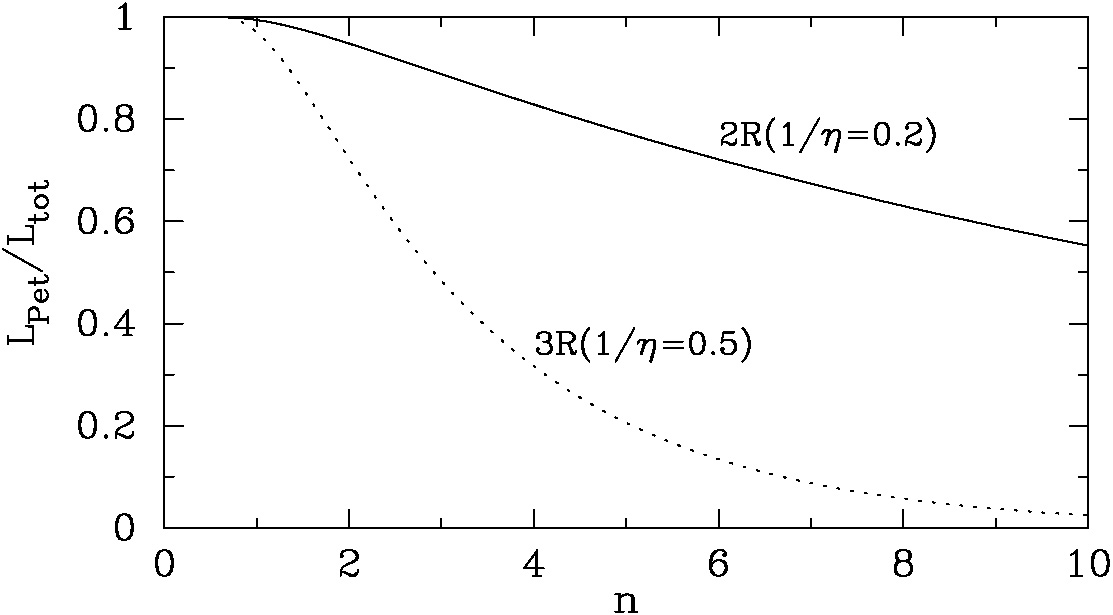 |
Figure 7. Flux ratio, as a function of
light-profile shape n, between the total luminosity
Ltot and the Petrosian luminosity
LPet inside (i) twice the radius
RP where
1 / |