Copyright © 2005 by Annual Reviews. All rights reserved
| Annu. Rev. Astron. Astrophys. 2005. 43:
xxx-xxx Copyright © 2005 by Annual Reviews. All rights reserved |


3.2. The Status of Deep Surveys: Resolved Fraction of the > 10 µm CIB
Many surveys from the mid-infrared to the millimeter have aimed to resolve the CIB into discrete sources. From short to long wavelengths the significant surveys are the following:
ISOCAM 15 µm: Three kinds of surveys have been done. The shallowest is the ELAIS survey (European Large-Area ISO Survey, Oliver et al. 2000). The deepest is the survey in the HDF-N (Aussel et al. 1999) as well as the surveys in the direction of the galaxy clusters (e.g. Metcalfe et al. 2003). Altogether, about 1000 galaxies were detected. Above a sensitivity limit of 50 µJy, they produce a 15 µm extragalactic background light of (2.4 ± 0.5) nW m-2 sr-1 (Elbaz et al. 2002). This accounts for about 80% of the CIB at 15 µm based on the simplest extrapolation of the counts.
| Wavelength (µm) | Experiment | Measurement | Reference |
| 0.2 | FOCA | Number counts & model | Armand et al. 1994 |
| 0.30, 0.56, 0.81 | HST/Las | Diffuse emission | Bernstein et al. 2002 |
| Campanas Obs. | Mattila 2003 | ||
2.2
<  <4 <4 |
IRTS | Diffuse emission | Matsumoto et al. 2005 |
| 2.2, 3.3 | DIRBE/Lick | Diffuse emission | Gorjian et al. 2000 |
| 1.25, 2.2 | DIRBE/2MASS | Diffuse emission | Wright 2001 |
| Cambrésy et al. 2001 | |||
| 10, 15 | CAT |  -rays -rays |
Renault et al. 2001 |
| 15 | ISO/ISOCAM | Number counts | Elbaz et al. 1999 |
| 24 | Spitzer/MIPS | Number counts | Papovich et al. 2004 |
| 60 | IRAS | Power spectrum | Miville-Deschênes et al. 2002 |
| 100 | DIRBE | Diffuse emission | Renault et al. 2001 |
| 140, 240 | DIRBE/WHAM | Diffuse emission | Lagache et al. 2000 |
| 140, 240 | DIRBE | Diffuse emission | Hauser et al. 1998 |
| 850 | SCUBA | Number counts | Smail et al. 2002 |
| 200
< <1200 |
FIRAS | Diffuse emission | Lagache et al. 2000 |
Spitzer 24 µm: Spitzer surveys are ongoing, but more than 105 sources have already been detected at 24 µm. Integrating the first number counts down to 60 µJy, a lower limit to the CIB at 24 µm of (1.9 ± 0.6) nW m-2 sr-1 is derived (Papovich et al. 2004). This accounts for about 70% of the CIB at 24 µm, based on a simple extrapolation of the counts.
Spitzer 70 µm: Counts have been derived down to 15 mJy. Integrating these counts corresponds 0.95 nW m-2 sr-1 which explains ~ 20% of the CIB at 70 µm as derived from the Lagache et al. (2004) model (Dole et al. 2004a).
ISOPHOT 90 µm: The most relevant data comes from the ELAIS survey that covers about 12 square degrees at 90 µm. Counts have been obtained down to 95 mJy (Héraudeau et al. 2004) resolving less than 5% of the CIB as derived from DIRBE by Renault et al. (2001).
Spitzer 160 µm: First counts are derived down to 50 mJy. The integral of these counts corresponds to 1.4 nW m-2 sr-1, which explain about 7% of the CIB at 160 µm (Dole et al. 2004a).
ISOPHOT 170 µm: Two main surveys have been conducted: the FIRBACK (Lagache & Dole 2001) and the Lockman hole (Kawara et al. 2004) surveys that covering about 5 square degrees. Counts down to 135 mJy contribute to less than 5% of the CIB (Dole et al. 2001).
SCUBA 450 µm: Deep surveys at 450 µm are very hard to conduct from the ground. A few galaxies are detected between 10 and 50 mJy in deep surveys. Number counts down to 10 mJy give a lower limit on the CIB of about (0.7 ± 0.4) nW m-2 sr-1 (Smail et al. 2002). This resolves about 15% of the CIB at 450 µm.
SCUBA 850 µm: Over 500
arcmin2 of blank sky has been surveyed
by several groups using SCUBA. The observations range from an
extremely deep survey in the area of the HDF-N to a wider-field
shallower survey. Also about 40 arcmin2 of lensed cluster fields
have been observed in which 17 sources have been detected. Fluxes
range from about 0.5 to 8 mJy. The flux density in the resolved
submillimeter population down to 1 mJy is (0.3 ± 0.1) nW
m-2 sr-1
(Smail et al. 2002).
This account for 60% of the CIB at
850 µm. Note that in deep surveys, sources with
S850 3 mJy
contribute to ~ 30% of the CIB.
3 mJy
contribute to ~ 30% of the CIB.
MAMBO 1200 µm: Deep blank sky areas surveyed by MAMBO cover about 500 arcmin2. Number counts are given by Greve et al. (2004). By integrating the counts from 2.25 to 5.75 mJy, the resolved CIB is about 0.02 nW m-2 sr-1, or about 10% of the total CIB at 1200 µm.
Figure 3 shows the capabilities of the different surveys to find distant LIRGs. Spitzer observations at 24 µm are the most powerful tool to find LIRGs up to z ~ 2.2; ISOCAM was limited at z ~ 1.2. Distant ULIRGs are found by deep and large surveys at 24 and 850 µm. Note that capabilities have been computed using the model of Lagache et al. (2004). This empirical model is based on only two populations of galaxies; it aims only to model the redshift evolution of the average population. It reproduces all the observations from mid-infrared to the millimeter (see Appendix). Lewis et al. (2005) showed that a more sophisticated, bivariate SED does not much change the average properties although it does significantly change the dispersion. The Lagache et al. (2004) model is thus used in this paper as a tool to discuss observations and predictions.
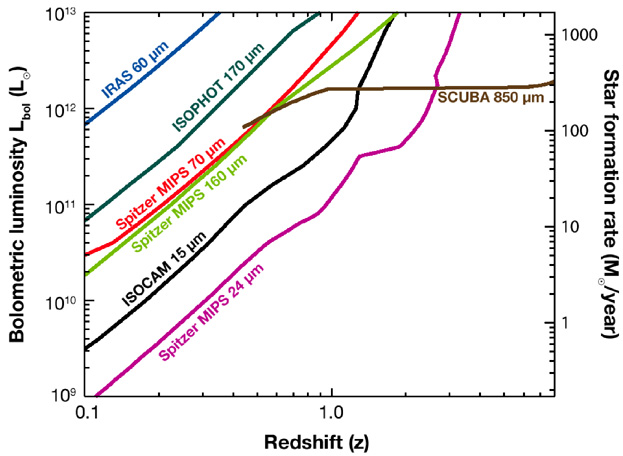 |
Figure 3. Sensitivity to the bolometric
luminosity and star-formation
rate, assuming star forming galaxies of various infrared and
submillimeter experiments. Detections of at least 10 sources in the
surveys can be expected in the areas above the curves.
We assumed the scenario of a typical deep survey (when available).
IRAS 60 µm
(S |
 > 1 Jy, all sky); ISOCAM 15 µm
(S
> 1 Jy, all sky); ISOCAM 15 µm
(S