Copyright © 2005 by Annual Reviews. All rights reserved
| Annu. Rev. Astron. Astrophys. 2005. 43:
xxx-xxx Copyright © 2005 by Annual Reviews. All rights reserved |


3.3. Redshift Contribution to the CIB
From Figure 2, we see that
contributions from galaxies
at various redshifts are needed to fill the CIB SED shape. The bulk
of the CIB in energy, i.e., the peak at about 150 µm, is not
resolved in individual sources but one dominant contribution at the
CIB peak can be inferred from the ISOCAM deep surveys. ISOCAM galaxies
with a median redshift of ~ 0.7 resolve about 80% of the CIB at
15 µm.
Elbaz et al. (2002)
separate the 15 µm galaxies
into different classes (ULIRGs, LIRGs, Starbursts, normal galaxies and
AGNs) and extrapolate the 15 µm fluxes to 140 µm
using template SEDs. A total brightness of (16 ± 5) nW
m-2 sr-1
is found, which makes up about two thirds of the CIB observed at 140
µm by COBE/DIRBE. Hence, the galaxies detected by ISOCAM are
responsible for a large fraction of energy of the CIB. About one half
of the 140 µm CIB is due to LIRGs and about one third to
ULIRGs. However, these ISOCAM galaxies make little contribution to the
CIB in the millimeter and submillimeter. There, the CIB must be
dominated by galaxies at rather high redshift for which the SED peak
has been shifted. The redshift contribution to the CIB is illustrated
in Figure 4. We clearly see that the
submillimeter/millimeter CIB contains information on the total energy
output by the high-redshift galaxies (z > 2). This is
supported by the
redshift distribution of the SCUBA sources at 850 µm with
S850  3 mJy that
make about 30% of the CIB and have a median redshift of 2.2
(Chapman et al. 2005).
3 mJy that
make about 30% of the CIB and have a median redshift of 2.2
(Chapman et al. 2005).
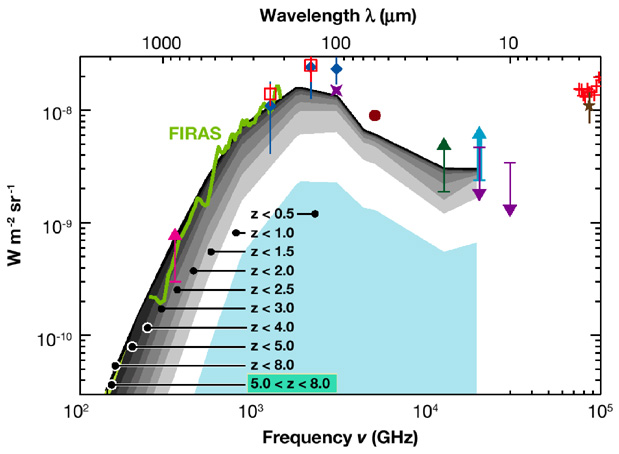 |
Figure 4. Cumulative contribution to the CIB of galaxies at various redshifts from 0.5 to 8, from the model of Lagache et al. (2004). Measurements of the CIB are reported with the same symbols as in Figure 2. |
Figure 5 shows the fraction of resolved CIB as a function of redshift for selected wavelengths. Fifty percents of the CIB is due to galaxies at redshift below 1 at 15 and 70 µm, 1.3 at 24 and 160 µm, 2 at 350 µm, 3 at 850 µm and 3.5 at 2000 µm (see also Table 2). It is clear that from the far-infrared to the millimeter, the CIB at longer wavelengths probes sources at higher redshifts.
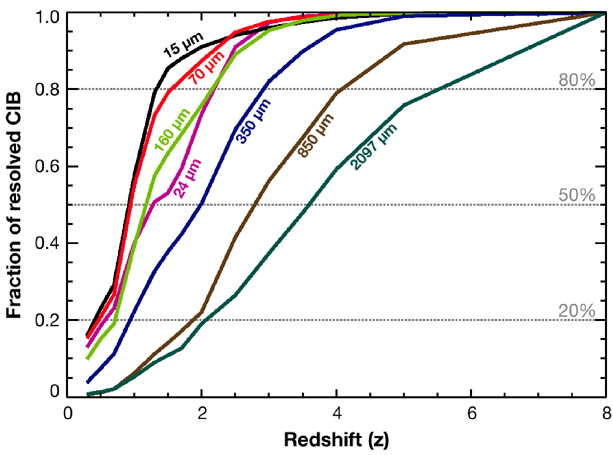 |
Figure 5. Cumulative fraction of the CIB content as a function of redshift for various wavelengths, from the model of Lagache et al. (2004). |
| Wavelength | 20% | 50% | 80% |
| 15 µm | 0.5 | 1.0 | 1.3 |
| 24 µm | 0.5 | 1.3 | 2.0 |
| 70 µm | 0.5 | 1.0 | 1.5 |
| 100 µm | 0.7 | 1.0 | 1.7 |
| 160 µm | 0.7 | 1.3 | 2.0 |
| 350 µm | 1.0 | 2.0 | 3.0 |
| 850 µm | 2.0 | 3.0 | 4.0 |
| 1.4 mm | 2.5 | 3.5 | 4.5 |
| 2.1 mm | 2.0 | 3.5 | 5.0 |
From Section 3.2, we see that the most constraining surveys in term of resolving the CIB are those at 15, 24 and 850 µm. Moreover, the capabilities of these surveys to find high-z objects are the best among all other existing surveys (see Figure 3). These surveys probe the CIB in well-defined and distinct redshift ranges, with median redshifts of 0.7 (Liang et al. 2004), ~ 1 (Caputi et al. 2005 and L. Yan, private communication), and 2.2 (Chapman et al. 2005) at 15, 24 and 850 µm, respectively. Such well-defined redshift ranges can be understood by looking at the K-correction. The K-correction is defined as:
 |
(1) |
where L (z = 0) is the rest-frame luminosity. This
correction is
specific to the spectrum of the population considered at a given
luminosity and redshift. Figure 6 shows the
K-correction at 15, 24, 70, 160 and 850 µm. The broad plateau
observed around z = 1 at 15 µm and around z =
2 at 24 µm is caused by the PAHs' features. At longer
wavelengths, the slow
decrease of the K-correction is caused by the shape of the starburst
spectra around the peak of their emission. At 850 µm, the
monotonic rise favors the detection of high-z objects.
(z = 0) is the rest-frame luminosity. This
correction is
specific to the spectrum of the population considered at a given
luminosity and redshift. Figure 6 shows the
K-correction at 15, 24, 70, 160 and 850 µm. The broad plateau
observed around z = 1 at 15 µm and around z =
2 at 24 µm is caused by the PAHs' features. At longer
wavelengths, the slow
decrease of the K-correction is caused by the shape of the starburst
spectra around the peak of their emission. At 850 µm, the
monotonic rise favors the detection of high-z objects.
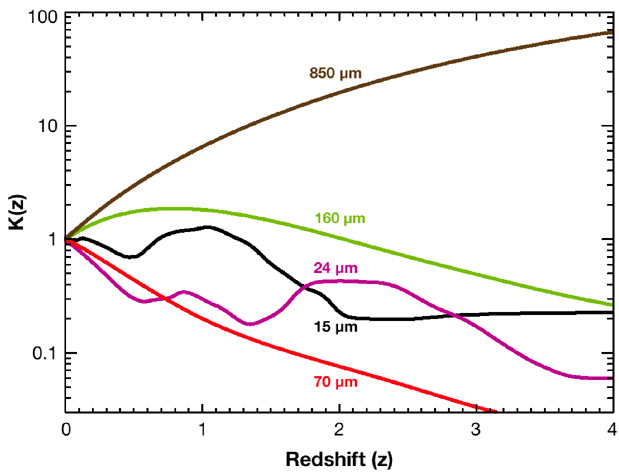 |
Figure 6. K-correction at 15, 24, 70 and
160 and 850 µm for a typical
LIRG with L = 2 × 10¹¹
L |
 (from the
model of
(from the
model of