Copyright © 2002 by Annual Reviews. All rights reserved
| Annu. Rev. Astron. Astrophys. 2002. 40:
539-577 Copyright © 2002 by Annual Reviews. All rights reserved |


4.2. The Cluster Abundance at Higher Redshifts and Its Evolution
A first analysis of the EMSS cluster sample (Gioia et al. 1990a) revealed negative evolution of the XLF - a steepening of the high-end of XLF indicating a dearth of high luminosity clusters at z > 0.3. This result was confirmed by Henry et al. (1992) using the complete EMSS sample with an appropriate sky coverage function. Edge et al. (1990) found evidence of a strong negative evolution already at redshifts < 0.2 using a HEAO-1 based cluster sample (see Section 3.2). The very limited redshift baseline made this result somewhat controversial, until it was later ruled out by the analysis of the first RASS samples (Ebeling et al. 1997). The ROSAT deep surveys extended the EMSS study on cluster evolution. Early results (Castander et al. 1995) seemed to confirm and even to reinforce the evidence of negative evolution. This claim, based on a sample of 12 clusters, was later recognized to be the result of sample incompleteness and an overestimate of the solid angle covered at low fluxes and its corresponding search volume (Burke et al. 1997, Rosati et al. 1998, Jones et al. 1998).
If cluster redshifts are not available, X-ray flux-limited samples can
be used to trace the surface density of clusters at varying fluxes. In
Figure 7, we show several determinations of the
cumulative cluster number counts stretching over five decades in
flux. This comparison shows a good agreement (at the
2 level) among
independent determinations (see also
Gioia et al. 2001).
The slope at
bright fluxes is very close to the Euclidean value of 1.5 (as expected
for an homogeneous distribution of objects over large scales), whereas
it flattens to
level) among
independent determinations (see also
Gioia et al. 2001).
The slope at
bright fluxes is very close to the Euclidean value of 1.5 (as expected
for an homogeneous distribution of objects over large scales), whereas
it flattens to  1 at
faint fluxes. The slope of the
LogN-LogS is mainly determined by the faint-to-moderate
part of the XLF, but it is rather insensitive to the abundance of the most
luminous, rare systems. The fact that the observed counts are
consistent with no-evolution predictions, obtained by integrating the
local XLF, can be interpreted as an indication that a significant
fraction of the cluster population does not evolve with redshift
(Rosati et al. 1995,
1998,
Jones et al. 1998,
Vikhlinin et al. 1998a).
We have included the recent data from the Chandra Deep Fields North
(Bauer et al. 2002)
and South
(Giacconi et al 2002),
which have
extended the number counts by two decades. Note that cosmic variance
may be significant because these are only two, albeit deep, pencil beam
fields (
1 at
faint fluxes. The slope of the
LogN-LogS is mainly determined by the faint-to-moderate
part of the XLF, but it is rather insensitive to the abundance of the most
luminous, rare systems. The fact that the observed counts are
consistent with no-evolution predictions, obtained by integrating the
local XLF, can be interpreted as an indication that a significant
fraction of the cluster population does not evolve with redshift
(Rosati et al. 1995,
1998,
Jones et al. 1998,
Vikhlinin et al. 1998a).
We have included the recent data from the Chandra Deep Fields North
(Bauer et al. 2002)
and South
(Giacconi et al 2002),
which have
extended the number counts by two decades. Note that cosmic variance
may be significant because these are only two, albeit deep, pencil beam
fields ( 0.1
deg2). Serendipitous surveys with Chandra and
XMM (see
Figure 4) will fill the gap
between these measurements and the ROSAT surveys. The no
evolution curves in Figure 7 are computed by
integrating the BCS local XLF
(Ebeling et al. 1997)
according to the evolutionary
model in Figure 9.
0.1
deg2). Serendipitous surveys with Chandra and
XMM (see
Figure 4) will fill the gap
between these measurements and the ROSAT surveys. The no
evolution curves in Figure 7 are computed by
integrating the BCS local XLF
(Ebeling et al. 1997)
according to the evolutionary
model in Figure 9.
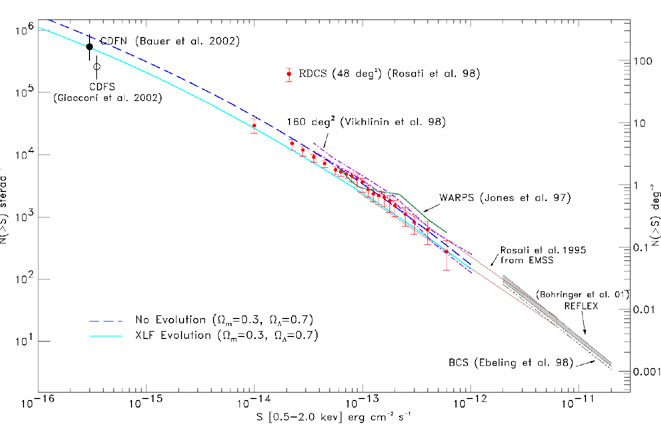 |
Figure 7. The cluster cumulative number counts as a function of X-ray flux (log N - log S) as measured from different surveys. |
A much improved picture of the evolution of the cluster abundance
emerged when, with the completion of spectroscopic follow-up studies,
several cluster samples were used to compute the XLF out to
z 0.8. These
first measurements are summarized in
Figure 8. Although binned representations of the XLF
are not straightforward to compare, it is evident that within the
error bars there is little, if any, evolution of the cluster space
density at LX([0.5 - 2] keV)
3 ×
1044 erg s-1
L*X out to redshift
z 0.8. These
results
(Burke et al. 1997,
Rosati et al. 1998,
Jones et al. 1998,
Vikhlinin et al. 1998a,
Nichols et al. 1999)
extended the original study of EMSS to
fainter luminosities and larger redshifts, and essentially confirmed
the EMSS findings in the overlapping X-ray luminosity range. The
ability of all these surveys to adequately study the bright end of the
XLF is rather limited, since there is not enough volume to detect rare
systems with
LX > L*X. The
160 deg2 survey by
Vikhlinin et al. (1998a),
with its large area, did however confirm the negative
evolution at LX
 4 ×
1044 erg s-1. Further analyses of
these datasets have confirmed this trend, i.e. an apparent drop of
super-L*X clusters at
z 0.5
(Nichol et al. 1999
from the Bright-SHARC survey;
Rosati et al. 2000
from the RDCS,
Gioia et al. 2001
from the NEP survey). These findings, however, were not confirmed by
Ebeling et al. (2000)
in an analysis of the WARPS sample.
4 ×
1044 erg s-1. Further analyses of
these datasets have confirmed this trend, i.e. an apparent drop of
super-L*X clusters at
z 0.5
(Nichol et al. 1999
from the Bright-SHARC survey;
Rosati et al. 2000
from the RDCS,
Gioia et al. 2001
from the NEP survey). These findings, however, were not confirmed by
Ebeling et al. (2000)
in an analysis of the WARPS sample.
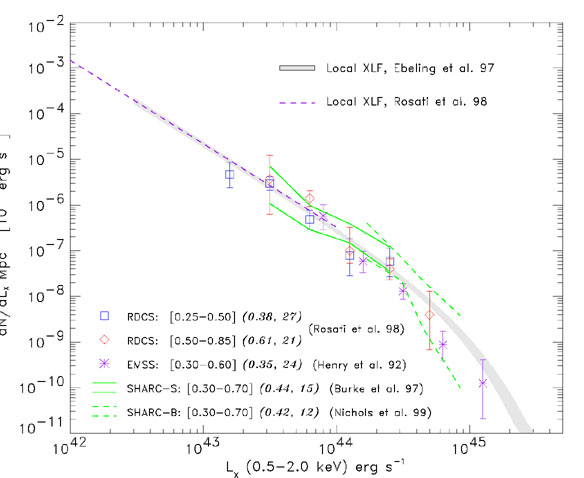 |
Figure 8. The X-ray Luminosity Function of
distant clusters out to
z |
The evolution of the bright end of the XLF has remained a hotly
debated subject for several years. The crucial issue in this debate is
to properly quantify the statistical significance of any claimed
evolutionary effect. The binned representation of the XLF in
Figure 8 can be misleading and can even lead to
biases
(Page & Carrera
2000).
The full information contained in any
flux-limited cluster sample can be more readily recovered by analyzing
the unbinned (LX, z) distribution with a
maximum-likelihood
approach, which compares the observed cluster distribution on the
(LX, z) plane with that expected from a given
XLF model.
Rosati et al. (2000)
used this method by modeling the cluster XLF as an evolving
Schechter function:
 (L) =
0(1
+ z)A
L-
(L) =
0(1
+ z)A
L- exp(- L / L*), with
L* =
L*0(1 + z)B;
where A
and B are two evolutionary parameters for density and luminosity;
0
and L*0 the local XLF values
(Equation 7).
Figure 9 shows an application of this method to
the RDCS and EMSS sample, and indicates that the no-evolution case
(A = B = 0) is excluded at more than
3 levels in both samples
when the most luminous systems are included in the analysis. However,
the same analysis confined to clusters with
LX < 3 × 1044 erg s-1
yields an XLF consistent with no evolution. In
Figure 9 we also report the latest
determinations of the XLF out to z ~ 1.
exp(- L / L*), with
L* =
L*0(1 + z)B;
where A
and B are two evolutionary parameters for density and luminosity;
0
and L*0 the local XLF values
(Equation 7).
Figure 9 shows an application of this method to
the RDCS and EMSS sample, and indicates that the no-evolution case
(A = B = 0) is excluded at more than
3 levels in both samples
when the most luminous systems are included in the analysis. However,
the same analysis confined to clusters with
LX < 3 × 1044 erg s-1
yields an XLF consistent with no evolution. In
Figure 9 we also report the latest
determinations of the XLF out to z ~ 1.
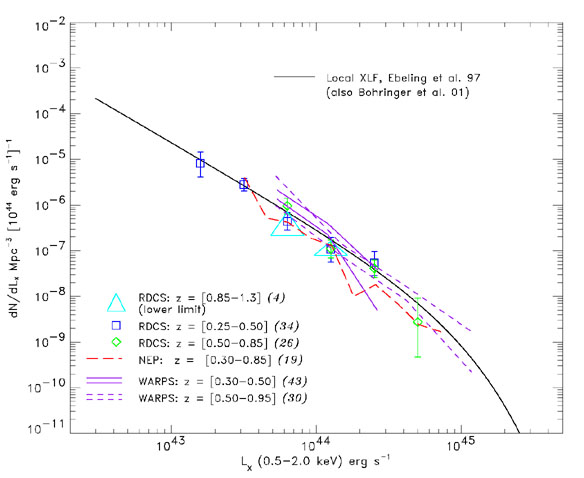 |
 |
Figure 9. (Left) the latest
compilation of distant XLFs (RDCS:
Rosati et al. 2000;
NEP:
Gioia et al. 2001;
WARPS:
Jones et al. 2000;
an Einstein-de-Sitter universe with
H0 = 50 km s-1 Mpc-1 is adopted).
Right panel: Maximum-likelihood contours (1, 2 and 3
|
|
In summary, by combining all the results from ROSAT surveys one
obtains a consistent picture in which the comoving space density of
the bulk of the cluster population is approximately constant out to
z 1, but the
most luminous (LX
L*X), presumably
most massive clusters were likely rarer at high redshifts (z
0.5). Significant
progress in the study of the evolution of the
bright end of the XLF would require a large solid angle and a
relatively deep survey with an effective solid angle of >> 100
deg2 at a limiting flux of 10-14 erg
cm-2 s-1.
The convergence of the results from several independent studies
illustrates remarkable observational progress in determining the
abundance of galaxy clusters out to z ~ 1. At the beginning of
the ROSAT era, until the mid nineties, controversy surrounded
the usefulness of X-ray surveys of distant galaxy clusters and many
believed that clusters were absent at z ~ 1. This prejudice arose
from an over-interpretation of the early results of the EMSS survey.
Gioia et al. (1990a)
did point out that the evolution of the XLF
was limited only to the very luminous systems but this important
caveat was often overlooked. The original controversy concerning cluster
evolution inferred from optical and X-ray data finds an explanation in
light of the ROSAT results. Optical surveys
(Couch et al. 1991,
Postman et al. 1996)
have shown no dramatic decline in the comoving
volume density of rich clusters out to
z 0.5. This was
considered to be in contrast with the EMSS findings. However, these
optical searches covered limited solid angles (much smaller than the
EMSS) and therefore did not probe adequately the seemingly evolving
high end of the cluster mass function.