


5.1. Introduction - Some Weighty Questions
We now turn to the exciting and rapidly developing area of understanding cosmic reionization. This event, which marks the end of the so-called `Dark Ages' when the intergalactic medium became transparent to ultraviolet photons, was a landmark in cosmic history. In some ways the event might be considered as important as the epoch of recombination which isolates the formation of the hydrogen atom, or the asssociated surface of last scattering when photons and baryonic matter decouple. In the case of the era of cosmic reionization, although we cannot yet be sure, many believe we are isolating that period when the first sources had sufficient output to contribute to the energy balance of the intergalactic medium. Even though some early luminous forerunners might be present, the epoch of reionization can be directly connected with cosmic dawn for starlight.
It seems an impossible task to give an authoritative observational account of how to probe this era. So many issues are complete imponderables! When did reionization occur? Was it a gradual event made possible by a complex time sequence of sources, or was there a spectacular synchronized moment? Can we conceive of an initial event, followed by recombination and a second phase?
What were the sources responsible? History has shown the naivety of astronomers in assuming a single population to be responsible for various phenomena - usually some complex combination is the answer. And, perhaps most ambitiously, what is the precise process by which photons escape the sources and create ionized regions?
Four independent observational methods are helpful in constraining the redshift range where we might search for answers to the above questions. In this lecture, we will explore how these work and the current (and rapidly changing) constraints they offer. These are:
 6.5, high quality
spectroscopic data gives us a glimpse of a potential change
in the degree of neutrality of the IGM beyond z
5.5
such as might be expected if reionization was just ending at
that epoch.
6.5, high quality
spectroscopic data gives us a glimpse of a potential change
in the degree of neutrality of the IGM beyond z
5.5
such as might be expected if reionization was just ending at
that epoch.
5-6
(Songaila 2004)
is highly indicative of a widespread process of earlier
enrichment from the first generation of supernovae.
5-6,
about 1 billion years after the
Big Bang, as probed by the remarkable combination of HST and Spitzer
(Stark & Ellis 2005,
Stark et al 2006a,
Yan et al 2006,
Eyles et al 2006).
A census of the mass
in stars must be the integral of past activity which can
be compared with that necessary to reionize the Universe.
5.2. The Gunn-Peterson Test and SDSS QSOs
In a remarkable paper, long before QSOs were located at redshifts beyond 2.5, James Gunn and Bruce Peterson realized (Gunn & Peterson 1965) that the absence of broad troughs of hydrogen absorption in the spectra of QSOs must indicate intergalactic hydrogen is ionized. They postulated a future test whereby the spectra of QSOs of successively higher redshift would be scrutinized to locate that epoch when the IGM was neutral.
For an optical spectrum, redshifted to reveal that
portion of the rest-frame UV shortward of the Lyman
 emission line of the QSO itself
(
emission line of the QSO itself
( 1216 Å), the
relative transmission T is defined as
1216 Å), the
relative transmission T is defined as
 |
where fcont represents the continuum radiation from
the QSOs. The transmission is reduced by Lyman
absorption in any foreground (lower redshift) clouds of neutral
hydrogen whose Gunn-Peterson opacity is then
 |
The first `complete troughs' in the absorption line spectra of distant QSO were presented by Becker et al (2001) and Djorgovski et al (2001) and a more comprehensive sampling of 11 SDSS QSOs was presented by Fan et al (2003). Recently, an analysis of 19 5.74 < z < 6.42 QSOs was presented by Fan et al (2006b).
Figure 35 illustrates how absorption structures
along the same line of sight can be independently probed using
Lyman and higher order
lines such as Lyman
 .
.
 |
Figure 35. The absorption line spectrum of
two SDSS QSOs from the recent study of
Fan et al (2006b).
Here the structures in the Lyman series absorption lines
|
To understand how this is effective, in a uniform medium
 GP is
related to the abundance of absorbing neutral hydrogen atoms by the
following expression:
GP is
related to the abundance of absorbing neutral hydrogen atoms by the
following expression:
 |
where f is the oscillator strength of the Lyman
line, H
is the redshift-dependent Hubble parameter and nHI is the
neutral number density.
Numerically, this becomes
 |
where xHI = (1 + z / 7)3/2 nHI / nH is then the neutral fraction.
Inspection of this equation is quite revealing. Firstly, even a tiny
neutral fraction, xHI ~ 10-4, would give a
very deep, seemingly complete GP trough; for reference xHI
10-5
today. So clearly the test is not a very sensitive one in absolute terms.
Secondly, since GP
 f , for the
same nH, the
optical depth in the higher order Lyman
and
f , for the
same nH, the
optical depth in the higher order Lyman
and
 lines would
be 6 and 18 times
smaller respectively.
lines would
be 6 and 18 times
smaller respectively.
In practice, the above relations are greatly complicated by any clumpiness in the medium. This affects our ability to make direct inferences on xHI as well as to combine the various Lyman lines into a single test.
Instead, workers have examine the relative distribution of
GP
with redshift independently from the various Lyman series absorption
statistics. An increase in
GP with redshift
could just be a natural thickening of the Lyman absorption forest and,
given its weak connection with xHI,
not imply anything profound about cosmic reionization. However, if it can
be shown empirically that the various diagnostics show a
discontinuity in the xHI-redshift trends,
conceivably we are approaching the neutral era.
Figure 36 shows that for z < 5.5,
(1 + z /
5)4.3
for both the Ly and
Ly forests to
reasonable precision. However, beyond z
5.5, both redshift
trends are much steeper,
(1 +
z)11. The dispersion around the trends also increases
significantly at higher redshift. Taken together, both results
suggest a qualitative change in nature of the IGM beyond z
5.5
(but for an alternative explanation see Becker et al 2006).
 |
Figure 36. Evolution in the Gunn-Peterson
optical depth, |
Fan et al (2006a,
b)
discuss several further probes of the nature of the IGM at z
6. One relates to the
proximity effect - the region around each QSO where it
is clear from the spectrum that the IGM is being ionized by
the QSO itself. Although this region is excluded in the analyses
above, the extent of this region contains valuable information
on the nature of the IGM. It appears that the radius of the region
affected, R is less at higher redshift according to
R
[(1 + z) xHI]-1/3 suggesting that
the most distant QSOs in the sample (z
6.5) lie in a IGM whose
neutral fraction is 14
times higher than those at z
5.7.
Another valuable measure is how the regions of complete
absorption, the so-called `dark gaps' in the spectrum where
transmission is effectively zero, are distributed. Fan et al define
a `gap' as a contiguous region in redshift space where
> 3.5.
The distribution of gaps contains some information on
the topology of reionization. We would expect regions of high
transmission to be associated with large HII regions, centered
on luminous star-forming sources. The dark gaps increase
in extent from 10 to
80 comoving Mpc over the redshift range samples suggesting the IGM is still
not neutral at z
6.5. Although the Gunn-Peterson and gap statistics make similar
statements about reionization, suggesting the neutral fraction at z
6.2 is 1-4%, Fan et al
consider that beyond z
6.5, gap statistics
will become a more powerful probe. This is because the redshift
distribution of those few spectroscopic pixels where the transmission
is non-zero will become the only effective signal.
5.3. Metallicity of the High Redshift IGM
A second measure of the redshift range of early star formation is
contained in the properties of the CIV forest observed in the
spectra of high redshift QSOs
(Songaila 2005,
2006).
Carbon is only produced in stellar nuclei (it is not produced in
the hot Big Bang) and so the ubiquity of CIV along many sightlines
to z 5-6 QSOs is
a powerful argument for early enrichment.
CIV was seen in the Ly
forest in 1995
(Cowie et al 1995)
with N(CIV) / N(HI) ~ 10-2 to 10-3. However, it was
subsequently seen in even the weakest
Ly systems
(Ellison et al 2000).
This is a particularly powerful point since it
argues that enrichment is not confined to localized regions of
high column density but is generic to the intergalactic medium
as a whole (Figure 37).
 |
 |
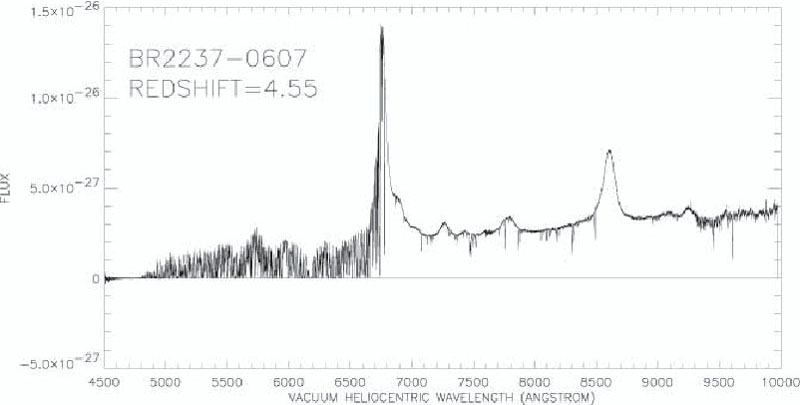
Figure 37. (Left) Keck ESI
absorption line spectrum of the z = 4.5 QSO BR2237-0607 from the study of
Songaila (2005).
A sparsely populated CIV forest from 7500-8500Å accompanies the
dense Ly |
|
A quantitative interpretation of the CIV abundance, in terms of
how much early star formation occurred earlier than the
highest redshift probed, relies on locating a `floor' in the
abundance-redshift relation. Unfortunately, the actual
observed trend, measured via the contribution of the ion
to the mass density
 (CIV) from
z 5 to 2,
does not seem to behave in the manner expected. For
example, there is no strong rise in the CIV abundance
to lower redshift despite the obvious continued star
formation that occurred within these epochs
(Songaila 2006,
Figure 38). This is a major puzzle (c.f.
Oppenheimer et al 2006).
(CIV) from
z 5 to 2,
does not seem to behave in the manner expected. For
example, there is no strong rise in the CIV abundance
to lower redshift despite the obvious continued star
formation that occurred within these epochs
(Songaila 2006,
Figure 38). This is a major puzzle (c.f.
Oppenheimer et al 2006).
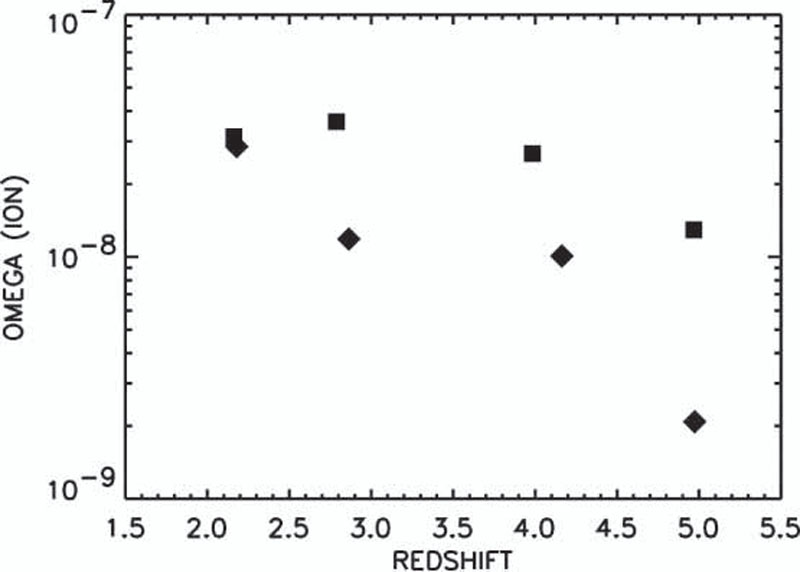 |
Figure 38. Modest evolution in the
contribution of intergalactic
CIV and SIV over 2 < z < 5 as measured in terms of the
ionic contribution to the mass density,
|
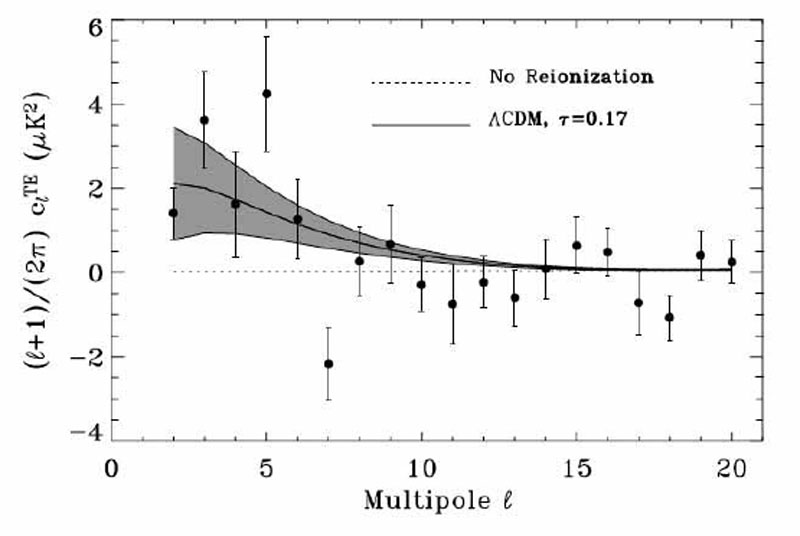
5.4. Linear Polarization in the WMAP Data
In 2003, the WMAP team
(Kogut et al 2003)
presented the temperature-polarization cross angular power spectrum from
the first year's data and located a
4 non-zero signal at
very low multipoles (l < 8)
which they interpreted in terms of foreground electron scattering of
microwave background photons with an optical depth
e = 0.17 ±
0.04 corresponding to ionized structures at zreion
20
(Figure 39a).
The inferred redshift range depends sensitively on
the history of the reionization process.
Bennett et al (2003)
argued that if reionization occurred instantaneously it corresponds to a
redshift zreion
17 ± 5, whereas
adopting a more reasonable Press-Schechter formalism and an illustrative
cooling and enrichment model,
Fukugita & Kawasaki
(2003)
demonstrated that the same signal can be interpreted with a delayed
reionization occurring at zreion
9-10.
non-zero signal at
very low multipoles (l < 8)
which they interpreted in terms of foreground electron scattering of
microwave background photons with an optical depth
e = 0.17 ±
0.04 corresponding to ionized structures at zreion
20
(Figure 39a).
The inferred redshift range depends sensitively on
the history of the reionization process.
Bennett et al (2003)
argued that if reionization occurred instantaneously it corresponds to a
redshift zreion
17 ± 5, whereas
adopting a more reasonable Press-Schechter formalism and an illustrative
cooling and enrichment model,
Fukugita & Kawasaki
(2003)
demonstrated that the same signal can be interpreted with a delayed
reionization occurring at zreion
9-10.
Just before the Saas-Fee lectures, the long-awaited third year WMAP data
was published
(Spergel et al 2006).
A refined analysis significantly
lowered both the normalization of the dark matter power spectrum to
8 = 0.74
± 0.05, and the optical depth to electron scattering to
e = 0.09 ±
0.03. The same model of instantaneous reionization reduces
the corresponding redshift to zreion = 11 ± 3
(2) - a significant
shift from the 1 year data.
To illustrate the uncertainties, Spergel et al introduce a more realistic
history of reionization via the ionization fraction
xe. Suppose above zreion,
xe  0
and below z = 7, xe
1. Then suppose
zreion
is defined as that intermediate point when xe =
xe0 for 7 < z <
zreion.
Figure 39b illustrates the remarkable
insensitivity of zreion to the
adopted value of xe0 for
xe0 < 0.5. Despite improved data,
the redshift range implied by the WMAP data spans the full range 10 <
z < 20.
0
and below z = 7, xe
1. Then suppose
zreion
is defined as that intermediate point when xe =
xe0 for 7 < z <
zreion.
Figure 39b illustrates the remarkable
insensitivity of zreion to the
adopted value of xe0 for
xe0 < 0.5. Despite improved data,
the redshift range implied by the WMAP data spans the full range 10 <
z < 20.
 |
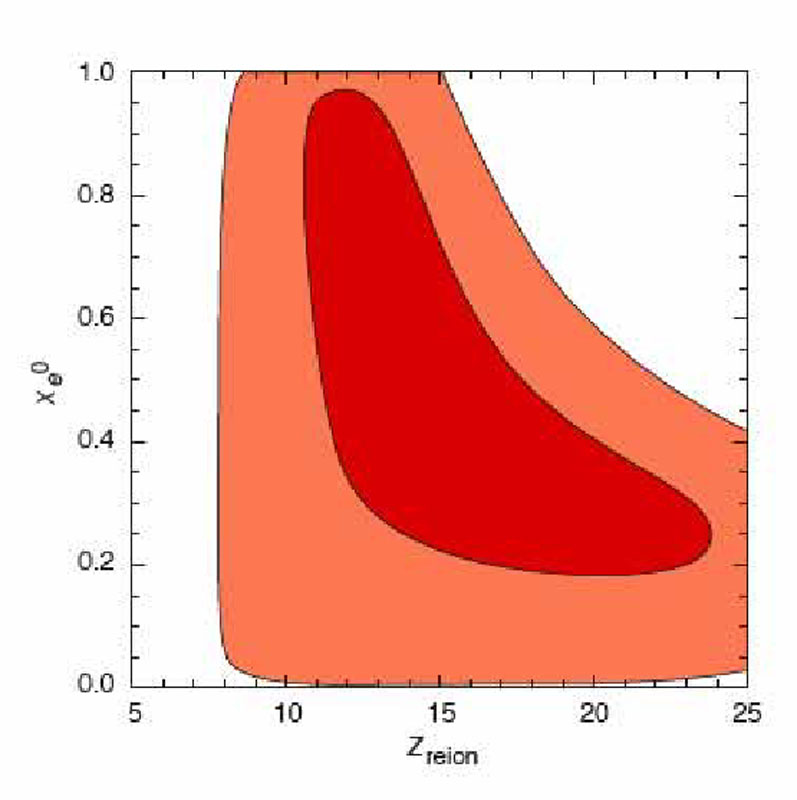 |
Figure 39. (Left) The
4 |
|
5.5. Stellar Mass Density at z
5-6
Neither the Gunn-Peterson test nor the WMAP polarization data necessarily demonstrate that reionization was caused by early star-forming sources; both only provide constraints on when the intergalactic medium was first reionized. The CIV test is a valuable complement since it provides a measure of early enrichment which can only come from star-forming sources. Unfortunately, powerful though the ubiquitous presence of CIV is in this context, as we have seen, quantitative constraints are hard to derive. We thus seek a further constraint on the amount of early star formation that might have occurred.
In Lecture 4 we introduced the techniques astronomers are now using to derive stellar masses for distant galaxies. Although the techniques remain approximate, it must follow that the stellar mass density at a given epoch represents the integral over time and volume of the past star formation. Indeed, we already saw a successful application of this in reconciling past star formation with the local stellar mass density observed by 2dF (Figure 21). Specifically, at a particular redshift, z
 |
Using the techniques described in Lecture 4, stellar mass
estimates have become available for some very high
redshift galaxies detected by Spitzer
(Eyles et al 2005,
Mobasher et al 2005,
Yan et al 2005).
For the most luminous Lyman `dropouts', these estimates are quite
substantial, some exceeding 1011
M implying
much earlier activity. Recently, several groups
(Stark et al 2006a,
Yan et al 2006,
Eyles et al 2006)
have been motivated to provide the first crude estimates on the volume
averaged stellar mass density at these early epochs.
Part of this motivation is to check whether the massive
galaxies seen at such high redshift can be reconciled
with hierarchical theory, but as
Stark & Ellis (2005)
proposed, the established stellar mass can also be used to probe earlier
star formation and its likely impact upon cosmic reionization.
implying
much earlier activity. Recently, several groups
(Stark et al 2006a,
Yan et al 2006,
Eyles et al 2006)
have been motivated to provide the first crude estimates on the volume
averaged stellar mass density at these early epochs.
Part of this motivation is to check whether the massive
galaxies seen at such high redshift can be reconciled
with hierarchical theory, but as
Stark & Ellis (2005)
proposed, the established stellar mass can also be used to probe earlier
star formation and its likely impact upon cosmic reionization.
A very relevant question is whether the observed mass density
at z 5-6 is
greater than can be accounted for by the
observed previous star formation history. We will review
the rather uncertain data on the star formation density
 *(z) beyond z
6 in the next
Lecture. However,
Stark et al (2006a)
find that even taking a reasonably optimistic measure of
*(z) from recent compilations
by Bouwens et al (2006)
and Bunker et al (2006),
it is hard to account for the stellar mass density at z
5
(Figure 40).
*(z) beyond z
6 in the next
Lecture. However,
Stark et al (2006a)
find that even taking a reasonably optimistic measure of
*(z) from recent compilations
by Bouwens et al (2006)
and Bunker et al (2006),
it is hard to account for the stellar mass density at z
5
(Figure 40).
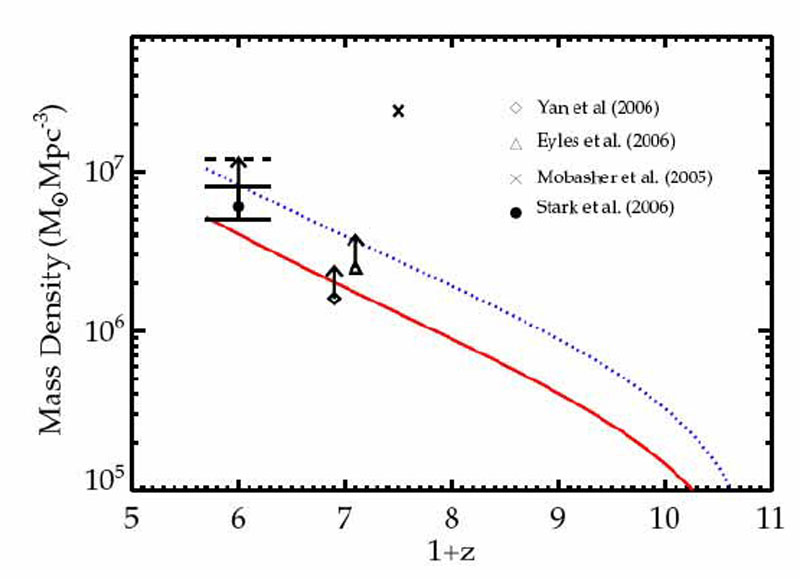 |
Figure 40. A comparison of the assembly
history of stellar mass
inferred from the observed decline in star formation history to
z |
There are currently two major limitations in this comparison. First, most of the v- and i-drops are located photometrically; even a small degree of contamination from lower redshift galaxies could upward bias the stellar mass density. On the other hand only star-forming galaxies are located by the Lyman break technique so this bias could easily be offset if there are systems in a quiescent state as evidenced by the prominent Balmer breaks seen in many of the Spitzer-detected sources (Eyles et al 2005, 2006). This limitation will ultimately be overcome with more careful selection methods and deeper spectroscopy. Secondly, and more profoundly, the precision of the stellar masses may not be up to this comparison. Much has to be assumed about the nature of the stellar populations involved which may, quite reasonably, be somewhat different from those studied locally. The discrepancy noted by Stark et al is only a factor of × 2-3, possibly within the range of uncertainty.
Regardless, if this mismatch is reinforced by better data, the
implications are very interesting in the context of reionization.
It could mean early star-forming systems are extincted, lie
beyond z 10
where current searches end, or perhaps most
likely that early star formation is dominated by lower luminosity
systems (Figure 40). By refining this technique
and using diagnostics
such as the strength of the tell-tale Balmer break, it may ultimately
be possible to age-date the earlier activity and compare its
efficacy with that required to reionize the Universe.
In this lecture we have introduced four very different and independent
probes of cosmic reionization, each of which suggests star formation
activity may extend well into the redshift range 6 < z <
20. Two of these probes rely on a contribution from early star formation
(the metallicity of the intergalactic
medium and the assembled stellar mass density at z
5-6).
The earliest result was the presence of neutral hydrogen troughs
in the spectra of distant QSOs. Although the arguments for reionization
ending at z 6
seem compelling at first sight, they ultimately
rely on an empirically-deduced transition in the changes in the opacity
of the Ly and
Ly
line below and above z
5.5.
The second result - the ubiquity of carbon in even the weakest absorbing
clouds at z 5 is
firm evidence for early star formation. However, it seems
hard to locate the high redshift `abundance floor' and hence to quantify
whether this early activity is sufficient for reionization. Indeed, a major
puzzle is the lack of growth in the carbon abundance over the redshift
range where galaxies are assembling the bulk of their stars.
The WMAP polarizations results have received the most attention, mainly because the first year data indicated a surprisingly large optical depth and a high redshift for reionization. However, there were some technical limitations in the original analysis and it now seems clear that the constraints on the redshift range when the foreground polarization is produced are not very tight.
Finally, an emerging and very promising technique is simply the
census of early star formation activity as probed by the stellar masses
(and ages) of the most luminous dropouts at z
5-6. Although
significant uncertaintes remain, the prospects for improving these
constraints are good and, at this moment, it seems there must have
been quite a significant amount of early (z > 6) star
formation activity, quite possibly in low luminosity precursors.